
A Yuge Jobs Gain Today

Popular Economics Weekly

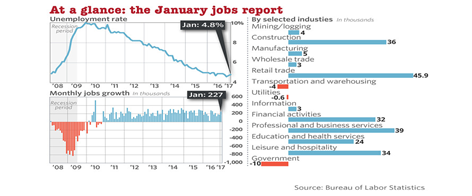
The U.S. created 227,000 new jobs in January to mark the largest gain in four months, revealing an economy that has plenty of stamina nearly eight years into a recovery that shows little sign of ending. Retailers, construction firms, financial companies and restaurants led the way in hiring in January, the government said Friday.
image

Graph: Marketwatch

The unemployment rate rose slightly to 4.8 percent last month, mostly because more people were looking for work, but there is a skills gap with most of the unemployed blue collar workers needing job retraining, rather than additional coal and manufacturing jobs the Trump team is hoping to generate. Job openings are near their record high and that’s drawing a larger share of Americans back into the labor force.

This is while a tighter labor market is also forcing firms to pay more to workers, an emerging trend that’s likely to further underpin the recovery. In January, hourly wages rose 0.1 percent to $26 an hour. Over the past 12 months wages have climbed 2.5 percent—faster than the less than 2 percent annual gains that prevailed through most of the recovery.

What does this mean? Maybe some of those unfilled 5.55 million job openings will be filled. But only if the courts lift the immigration ban that will discourage the influx of skilled workers to fill those jobs, as the Trump administration seems caught in the grips of white nationalist wall-builders, at the moment, such as Steven Bannon, who are very unskilled at writing Executive Orders, it seems.

Chaos is reigning over the immigration ban, at the moment. The global confusion that has since erupted is the story of a White House that rushed to enact, with little regard for basic governing, a core campaign promise that Mr. Trump made to his most fervent supporters, reports the New York Times. In his first week in office, Mr. Trump signed other executive actions with little or no legal review, but his order barring refugees has had the most explosive implications.

Passengers were barred from flights to the United States, customs and border control officials got instructions at 3 a.m. Saturday and some arrived at their posts later that morning still not knowing how to carry out the president’s orders.

Back to the jobs report, there was a huge surge in retail payrolls (46,000), professional services (39,000), and construction jobs (36,000), signaling real estate is still strong, with interest rates still near their record lows.

image

Graph: Econoday

More big news was that the service sector is still booming, though it dropped slightly in January. The ISM non-manufacturing, or service sector index “The NMI® registered 56.5 percent which is 0.1 percentage point lower than the seasonally adjusted December reading of 56.6.

Both prices and employment jumped 2.9 and 2.0 percent, respectively, again signaling a tighter labor market. The sector that includes Health Care & Social Assistance; Finance & Insurance; Public Administration; Accommodation & Food Services; Retail Trade; Construction; still reflects strong growth.

“This represents continued growth in the non-manufacturing sector at a slightly slower rate,” said Anthony Nieves, chair of the Institute for Supply Management® (ISM®) Non-Manufacturing Business Survey Committee. “Respondents’ comments are mixed indicating both optimism and a degree of uncertainty in the business outlook as a result of the change in government administration.”

So this uncertainty is another reason to cancel or modify Trump’s immigration ban, as it hurts more than the seven Muslim countries. Scientists worldwide are now cancelling scientific conferences in the US in protest.

Harlan Green © 2017

Follow Harlan Green on Twitter: https://twitter.com/HarlanGreen
Posted in Consumers, Economy, Macro Economics, Politics, Weekly Financial News | Tagged , , , , , | Leave a comment

Private Payrolls, Consumer Confidence Signal Strong January

Popular Economics Weekly

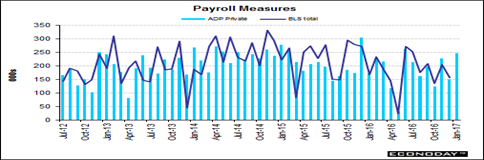
ADP is calling for substantial strength in Friday’s employment report, showing yesterday 246,000 for private payrolls, not including government jobs. This is far beyond expectations and would compare with December private payroll growth in the government’s report of 144,000 (ADP’s count for December is revised slightly lower to 151,000).

Yesterday’s data follow positive employment indications in Tuesday’s consumer confidence report and may very well pull expectations higher for Friday’s employment report, says Econoday.

image

Graph: Econoday

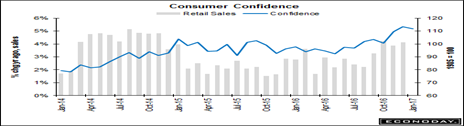
And the Conference Board’s consumer confidence survey showed further consumer strength. Consumer confidence held strong and steady in January, at 111.8 for only a slight decrease from December’s 15-year high of 113.3 (revised), said the Conference Board. Details are positive including a noticeable decline in those saying jobs are hard to get right now, at 21.5 percent vs December’s 22.7 percent, combined with a solid rise in those who say jobs are plentiful, at 27.4 vs 26.0 percent.

image

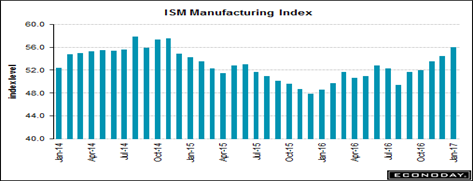
Then we also have the ISM manufacturing index back to post-recession highs. The ISM manufacturing report out Wednesday, in line with a run of regional reports, is signaling the strongest conditions in the factory sector since the oil-price collapse of 2014. The composite index for January is 56.0 for a sizable 1.5 point gain and the highest reading since November 2014.

New orders at 60.4 vs 60.3 in December is also a high since November 2014 and is the first back-to-back 60 showing since December 2013. Employment is also strong, up a sharp 3.3 points to 56.1 for the highest reading since August 2014. Inventories are steady as are delivery times which have been slowing in line with rising activity. Input costs are showing increasing pressure, in line with rising costs in other anecdotal reports.

 image

Graph ISM

So what have we for economic prospects in the Trump era? A lot will depend on the markets confidence that the Trump team can follow through on its promises. But limiting immigration when the economy is basically fully employed is not a recipe for further growth, because where will the workers come from to build all those infrastructure projects, for instance?

Probably from overseas. Or maybe from some of the unemployed blue-collar workers that don’t have the skills in today’s high tech economy. Though housing construction is rising, public construction spending fell a sharp 1.7 percent in the month. Educational spending fell 2.2 percent with highways & streets down 0.6 percent. Private nonresidential categories are mixed with total spending for this component unchanged in the month.

Also, where will the additional monies come from to finance those Trump projects?

Harlan Green © 2017

Follow Harlan Green on Twitter: https://twitter.com/HarlanGreen
Posted in Consumers, Economy, housing market, Weekly Financial News | Tagged , , , , , | Leave a comment

Pending Home Sales—Case-Shiller Prices Higher

image

The Mortgage Corner

Pending home sales picked up in December as solid increases in the South and West offset weakening activity in the Northeast and Midwest, according to the National Association of Realtors®. And the S&P Case-Shiller Home Price Index of same existing-home prices continued to rise more than inflation, signaling a housing shortage still exists.

The Pending Home Sales Index, a forward-looking indicator based on contract signings, increased 1.6 percent to 109.0 in December from 107.3 in November. With last month’s uptick in activity, the index is now 0.3 percent above last December (108.7). Pending sales have been this active since 2015, really, which in turn has stimulated housing construction, mostly on the high end.

image

Graph: NAR

Lawrence Yun, NAR chief economist, says contract activity was mixed throughout the country in December but ultimately ended on a high note to close out 2016. “Pending sales rebounded last month as enough buyers fended off rising mortgage rates and alarmingly low inventory levels to sign a contract,” he said. “The main storyline in the early months of 2017 will be if supply can meaningfully increase to keep price growth at a moderate enough level for households to absorb higher borrowing costs. Sales will struggle to build on last year’s strong pace if inventory conditions don’t improve.”

And national home price gains maintained momentum in November, two months after retaking the high last seen at the height of the housing bubble, according to Case-Shiller.

The S&P/CoreLogic Case-Shiller 20-city index rose 5.3 percent compared to a year ago for the three month period ending in November, an acceleration from the 5.1 percent increase notched in October. The national price index rose 5.6 percent for the year, up from 5.5 percent in October, and a yuge seasonally adjusted 0.8 percent for the month. Among the 20 cities, Seattle, Portland and Denver continued to see the strongest price gains.

According to Yun, a large portion of overall supply right now is at the upper end of the market, as we said. This is evident by looking at December data on the year-over-year change in single-family sales by price range. Last month, sales were up around 10 percent compared to December 2015 for homes sold at or above $250,000, while homes sold between $100,000 and $250,000 only increased 2.3 percent. Meanwhile, sales of homes under $100,000 were down 11.6 percent compared to a year ago.

image

Graph: NAR

This could be because mortgage rates have risen, though a 30-year fixed conforming rate is still 4.0 percent for one origination point in California. This is approximately 0.75 percent higher that the record lows of last yar.

“The dismal number of listings in the affordable price range is squeezing prospective first-time buyers the most,” said Yun. “As a result, young households are missing out on the wealth gains most homeowners have accrued from the 41 percent cumulative rise in existing home prices since 2011.”

Metro

Monthly Case-Shiller

12-Month Change

Atlanta

0.0%

6.1%

Boston

0.4%

5.5%

Charlotte

0.3%

5.9%

Chicago

-0.8%

4.0%

Cleveland

0.0%

3.8%

Dallas

0.2%

8.1%

Denver

0.6%

8.7%

Detroit

-0.1%

6.6%

Las Vegas

0.3%

6.0%

Los Angeles

0.2%

5.5%

Miami

0.5%

6.1%

Minneapolis

0.1%

5.5%

New York

0.4%

2.4%

Phoenix

0.3%

5.2%

Portland

0.2%

10.1%

San Diego

0.3%

5.8%

San Francisco

-0.1%

5.3%

Seattle

0.2%

10.4%

Tampa

0.8%

8.1%

Washington

0.2%

3.7%

Harlan Green © 2017

Follow Harlan Green on Twitter: https://twitter.com/HarlanGreen
Posted in Housing, housing market, Weekly Financial News | Tagged , , , | Leave a comment

Q4 GDP Slightly Lower—How About 2017?

Financial FAQs

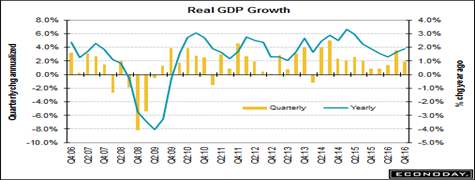
Fourth quarter Gross Domestic Product growth slowed, mostly because of the strong dollar and weak foreign demand. But consumers held up their end with higher consumer sentiments, and businesses also began to invest in new plants and equipment again.

One reason for the weakness is surging domestic demand for imported goods, because consumers are buying lots of goods and services. So all-in-all, the U.S. economy is doing very well, with interest rates still low and domestic demand still strong.

image

Graph: Econoday

Gross domestic product, the official score card for the economy, expanded at a 1.9 percent annual clip from October to December, the Commerce Department said. That’s a marked drop from a 3.5 percent growth rate in the third quarter and below the 2.2 percent consensus of Bloomberg. The drop was mainly because of lower exports (strong dollar) and higher imports, which are a subtraction in the calculation of GDP, increased.

Still, the increase in real GDP in the fourth quarter reflected positive contributions from personal consumption expenditures (PCE), private inventory investment, residential fixed investment, nonresidential fixed investment, and state and local government spending.

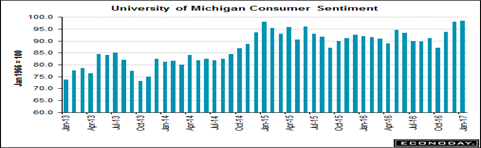
And we have soaring consumer sentiment, as the University of Michigan Consumer Sentiment survey is now at 98.5 in January, at the cycle highs where it’s been since the November election. Prospects for future income are the highest in a decade, though the sample is split between optimism among Republicans offsetting pessimism among Democrats. One fifth of the sample says it’s a good idea to borrow in advance of possible rate increases, a 20-year high for this reading.

image

Graph: Econoday

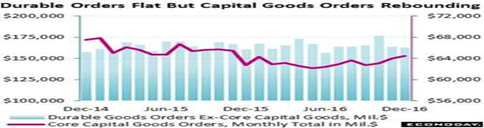
But the real hero of the week was durable goods orders for goods lasting more than 3 years, such as auto, appliances and aircraft. Even though December orders, pulled down by a swing lower in defense aircraft, slipped 0.4 percent, core capital goods orders rose 0.8 percent which is on top of an upward revised 1.5 percent gain in November.

image

Graph: Econoday

This is the sign of the increase in business investment in plants and equipment that will be sorely needed to increase productivity and so economic growth in 2017. Year-on-year core capital goods orders (nondefense ex-aircraft) moved into the plus column for the first time since October 2015, at 2.8 percent to exceed total orders at 1.2 percent. The graph tracks monthly dollar levels of core capital goods (at $64.5 billion in December) against all other durable goods (at $162.5 billion). This swing higher for capital goods has contributed to three straight quarters of gains, though small ones, for nonresidential investment in the GDP report. But progess is progess, says Econoday.

So we can only hope that President Trump doesn’t start too many trade wars, such as with Mexico, our third largest trading partner, if GDP growth is to improve from the past decade. For most of our exports and core capital goods depend on parts made elsewhere. We have a worldwide interconnected economy, in other words, which a trade war could harm greatly.

Harlan Green © 2017

Follow Harlan Green on Twitter: https://twitter.com/HarlanGreen

Posted in Consumers, Politics, Weekly Financial News | Tagged , , , , | Leave a comment

President Trump’s Bully Mentality

image

Popular Economics Weekly

President Trump’s first days in office were alarming for several reasons. He immediately began attacking the press, while intentionally stating falsehoods such as he would have won the popular vote, but for “3 to 5 million” fraudulent votes. Or, maybe they weren’t intentional falsehoods? Since most of those falsehoods are easily debunked, such as the size of the crowds at Friday’s Inauguration and Saturday women’s march.

Then you have the CIA meeting, where he stated that it was the lying media that made up his dispute with the intelligence community, whereas it is easy to check Trump’s speeches and Twitter messages for all to see he was the one that criticized the intelligence community for their findings that Vladimir Putin’s intelligence services wanted him elected.

So could it be that he is delusional, the words of Mother Jones’ David Corn? Or is it possible that he only listens to news from the likes of Breitbart, The National Inquirer, Fox, and Russ Limbaugh that cater to his voters, not the mass media that reports to the rest of US?

No, it is far more likely that he believes his success in business, such as it is, was due to his bullying tactics, tactics that browbeat investors and lenders to such an extent that he can no longer rely on U.S. investors and banks to finance his projects. So he doesn’t care—and may even have contempt for—facts or truths or any kind that don’t further his agenda.

A New York Times reporter on Lawrence O-Donnell’s MSNBC Last Word said it reminded her of the behavior of dictators, such as the current Russian and Chinese autocrats who considered all news as grist for their propaganda mills.

I have written about the bully mentality several times that has led to increased bullying in school, and even gun violence. It is a mentality that attempts to impose a bully’s version of reality on the real world for the sole purpose of domination. President Trump has always acted the bully, which is the reason for his history of lawsuits and bankruptcies, so that facts are only useful in so much as they support his positions.

Evidence of Trump’s bullying tactics also comes from his words on Twitter and elsewhere, reports Groff Beattle, a professor of Psychology at Edge Hill University who specializes in gestures, has discussed how Trump uses the body language and mannerisms of a bully, such as the exaggerated use of his hands.

Also comments such as “mentally sick”, “dummy”, “looser” or “looked disgusting” are all examples of bullying language on Trump’s Twitter. Trump’s bullying tactics include calling President Obama the founder of a terrorist organisation and insinuating that Clinton took drugs prior to a debate. Furthermore, he has mocked the disability of reporter Serge Kovaleski, portrayed immigrants and foreigners as dangerous people, rapists or “criminal aliens”, and demonstrated a significant lack of respect for women generally.

How does one oppose such destructive behavior? First, remember that bullies have to prey on the weakest, and avoid confrontation with those stronger because of their own insecurities. Trump preyed on naïve students and the elderly in his Trump University scam. And he stiffed workers and employees when building his Trump Casinos either by paying them less than was contractually agreed to, or not at all.

Combine it with his case-study narcissism that requires he be constantly in the limelight. So standing up to such a bully means the news media should ignore his tantrums, rather than commenting on them. Remember that he makes such outrageous lies to gain even more attention.

Psychology Today has posted a list of bullying behavior, a list that fits President Trump like a glove:

– Uncontrolled anger and unpredictable irritability, frequently directed at the weakest people (‘safe targets’) or those perceived as a future threat

– A sociopathic ability to control their own image – the selective ability to look like a different person to different audiences – for example, being aggressive to ‘subordinates’, while being charming and helpful to others

– Having little status outside of work, bullies wield the power that their job gives them with vicious zeal

– Running ‘witch-hunts’

– Gratuitous domineering behaviour – sometimes physical

– The ability to make the unreasonable seem reasonable, even to the victims

–Projecting their own inadequacies onto others

– Making irrational accusations

– Publicly putting people down

– Sadistic enjoyment in humiliating others

The list is endless of President Trump’s bullying tactics, and the responses are well known. There is even a government website, https://www.stopbullying.gov/ to help understand what the bully mentality is all about.

How sad it is that this US President, now the most powerful person on earth, is setting such an example of his own weakness and insecurity.

Harlan Green © 2017

Follow Harlan Green on Twitter: https://twitter.com/HarlanGreen

Posted in Politics, Uncategorized | Tagged , , , | Leave a comment

Has Inflation Returned?

Financial FAQs

Inflation is here! says Econoday, per last week’s CPI report; at 2.1 percent for total consumer prices (columns in graph) and 2.2 percent for the core rate (red line). Two percent is generally considered the target rate for inflation, the rate consistent with stable and sustainable economic growth.

The last time both the CPI and the core were actually together at the 2 percent line was way back in February 2013. And then it plunged into negative territory, as the federal government shut down in 2013 for two weeks over Republican’s refusal to raise the debt ceiling. The U.S. had already lost its S&P AAA rating on sovereign Treasury debt in 2011, and instituted the sequester agreement putting an across the board cap on government spending.

Then oil prices plunged along with worldwide commodity prices in 2014 due to slowing growth in the so-called BRIC emerging economies (Brazil, Russia, India, and China), so that U.S. industries cut back their investment spending, as well.

image

Graph: Econoday

The current rise in the CPI is mostly due to higher energy prices as economic activity (and oil prices) have picked up with U.S. final Q3 GDP growth at 3.5 percent. Energy prices are up 1.5 percent in the month, their fourth straight strong monthly gain with the yearly rate now well above the inflation rate at 5.4 percent.

But inflation may not be here to stay, as there is massive uncertainty over what exactly the Trump economic policies will be. Tax cuts and fewer government regulations will certainly stimulate additional growth, and so higher inflation, which is necessary to put more people back to work.

Medical care has also been a consistent source of strength though recent readings have been fading, up only 0.2 percent in December for a yearly 4.1 percent. Housing is another area of strength, up a tangible 0.3 percent in the month and at 3.0 percent year-on-year. Owners’ equivalent rent, which is a closely watched subcomponent of housing, also rose 0.3 percent.

image

Graph: Econoday

Where will the growth come from? From the manufacturing sector, if Trump succeeds in implementing that massive $1 trillion infrastructure spending he has promised. The manufacturing component of the industrial production could manage only a 0.2 percent gain in December, said Econoday, one that followed a 0.1 percent decline in November.

Factory output during 2016 (red line) proved dead flat once again, not getting any help from exports (columns). Exports were on the rise several years back and were helping production as seen on the left side of the graph, but the progress has since fizzled, as the BRIC economies are still in a recession mode.

So there may not be much inflation this year. And the Fed would counteract any inflation increase with higher interest rates, anyway, which they said they would do maybe two or three times in 2017, if necessary.

Harlan Green © 2016

Follow Harlan Green on Twitter: https://twitter.com/HarlanGreen

Posted in Consumers, Economy, Politics, Weekly Financial News | Tagged , , , | Leave a comment

Housing Starts Surge With Builder Optimism

The Mortgage Corner

A surge in multifamily production resulted in overall nationwide housing starts rising 11.3 percent to a seasonally adjusted annual rate of 1.23 million units, according to newly released data from the U.S. Department of Housing and Urban Development and the U.S. Census Bureau. This is Yuge, and will help to ease the shortage of rental units that has been driving up rental rates, squeezing low and moderate-income renters out of some housing markets.

Single-family construction dropped 4 percent to a seasonally adjusted annual rate of 795,000 units, but that was still 3.9 percent higher in a year. Multifamily production jumped 57 percent to 431,000 units in December. However, the monthly data for apartment production has exhibited strong volatility since August, sand the National Association of Home Builders. Still this may stop the average rent increase of 7 percent annually in high growth regions.

image

Graph: Calculated Risk

“This report represents firm growth for housing in 2016, as single-family starts rose 9 percent and multifamily production was down slightly,” said NAHB Chief Economist Robert Dietz. “We expect that 2017 will be another year of gradual, steady improvement in the housing market. Multifamily starts have been volatile in recent months, but should level off as supply meets demand. Meanwhile, single-family production continues to gain momentum but is limited by supply-side headwinds.”

Regionally in December, combined single- and multifamily housing production rose 31.2 percent in the Midwest, 23.5 percent in the West and 18.5 percent in the Northeast. The South posted a loss of 1.4 percent. That is an incredible increase in mid-winter, and reflects the rush to build before the predicted rise in interest rates this year.

The National Association of Home Builders (NAHB) also reported that though the housing market index (HMI) of builder optimism in future housing construction dropped slightly to 67 in January, down from 69 in December, any number above 50 indicates that more builders view sales conditions as good than poor. And this is easily the highest confidence rating since the end of the Great Recession.

image

Graph: NAHB

The slight drop in confidence may also be because of uncertainty over future building regulations, which are set state by state, rather than nationally, and interest rates, of course, which many predict will rise, as I said.

So despite the January drop, some builders say there are still reasons to be bullish. “Builders begin the year optimistic that a new Congress and administration will help create a better climate for small businesses, particularly as it relates to streamlining and reforming the regulatory process,” said NAHB Chairman Granger MacDonald.

Such optimism will evaporate, however, if interest rate rise sharply. But with the conforming 30-year fixed rate falling back to 3.75 percent in California of late, that may not happen. Could it be that optimism over future growth could also mean higher inflation, which means higher interest rates, as well?

This writer is optimistic that with Janet Yellen and her Fed Governors still cautious about forecasting higher growth and inflation—where will all those workers come from that will be needed for any new infrastructure projects when there is already a shortage of construction workers—remains to be seen.

Harlan Green © 2017

Follow Harlan Green on Twitter: https://twitter.com/HarlanGreen
Posted in Consumers, housing market, Weekly Financial News | Tagged , , , , | Leave a comment

Strong Retail Sales, Job Growth in 2017?

Financial FAQs

The prospects for 2017 growth are confusing, to say the least. For instance, will Prez-Elect Trump initiate multiple trade wars by pushing through tariffs on foreign imports to bring manufacturing jobs home to the U.S.? And/or will this cause the dollar’s value to continue to rise, thus harming the resulting exports, which could cancel out much of the benefits of bringing manufacturing jobs home (since manufacturing sector depends largely on exports)?

image

Graph: Econoday

But retail sales should benefit from the post-election rise in consumer confidence, though mostly via online sales (since prices are generally lower for online goods). Econoday reports non-store sales rose 1.3 percent in December for a year-on-year rate of 13.2 percent, among the very best showings and last exceeded in November 2011. So, taking in the whole and not just ecommerce or autos, there’s more off notes than on notes in the December retail sales report, per Econoday. Consumer spirits may be very high and if this benefited retail sales in December, it was mostly isolated to vehicles when looking at in-store sales.

And there’s already plenty of jobs out there, exactly 5.522 million of them in November, as I said last week. This against only 5.160 million hires in the month, a wide gap over the last couple of years as employers find it difficult to fill slots.

But get this, Econoday also says if each of those 5.522 million jobs were immediately filled, the number of unemployed would fall to 1.887 million for an unemployment rate of 1.2 percent, which will never happen. There are too many working-age adults who either won’t or can no longer work due to disabilities, lack of employable skills and the like.

Widening out the definition of unemployment (i.e., to those not even looking for work) does soften the view of labor slack but even here the pool of available workers, at 13.2 million in December, is shrinking, down from 14.0 million as recently as September.

image

Graph: Econoday

So the 2017 growth picture is still too fuzzy to see clearly. Consumer and business optimism can change to pessimism in a flash; or a Tweet.

Harlan Green © 2016

Follow Harlan Green on Twitter: https://twitter.com/HarlanGreen
Posted in Consumers, Politics, Weekly Financial News | Tagged , , , , | Leave a comment

Who Killed Our Middle Class?

image

Popular Economics Weekly

It’s becoming clear that our Middle Class—the midsection of U.S. earners and consumers—has shrunk alarmingly. And this is the main reason for the political polarization today that in the words of journalist Christopher Hedges, has driven the Republican Party “insane”.

Our society has become so polarized that Donald Trump needed the support of the Ku Klux Clan, white nationalists, and Vladimir Putin to become President-Elect. Whereas it has been the Middle Class values of probity, honesty and a belief in science, first satirized in Moliere’s Le Bourgeois Gentilhomme, (The Middle Class Gentleman), that have been the stabilizing influence in American politics since WWII.

The main difference between poverty and middle class and between middle class and wealthy, noted one researcher, “is belief in, and planning for, moving up as a working assumption.” A report from the Pew Research Center found that, for the first time since the 1970s, families defined as “middle income” are actually in a minority in the US – squeezed from both ends by an enlarged poverty-stricken group below them, and an enriched group above them.

image

Graph: Fortune Magazine

This graph shows the shrinkage of those defined as middle class from 1979 to 2014—from 38.8 percent (gray line) to 32.09 percent (blue line), according to a Pew research study. The shrinkage reads like a textbook example of the future that French economist Thomas Piketty predicts for the world in his best-selling, Capital in the Twenty-First Century.

In 1971, there were 80 million households in the US defined as middle income – compared with a combined 52 million in the groups above and below. Now, there are 120 million middle-class families, but 121 million rich and poor – “A demographic shift that could signal a tipping point,” says Pew.

So who or what is at fault for the result; record income inequality last reached in 1929 that led to the Great Depression? We can fault President Reagan, who was first to break the unions with his firing of all federally employed Air Traffic Controllers that belonged to PATCO, the traffic controllers union.

Or conservatives’ espousal of the Reagan motto, “government is the problem,” which caused massive downsizing of government regulation, as well as regulators, and the ensuing de-regulation of whole industries, such as the airlines, telecommunications, and financial markets.

But the truth may be much closer to the present—in fact, from the Presidency of Bill Clinton. For it was President Clinton who veered so far to the right in his 1966 reelection campaign (thanks to Republican strategist Dick Morris) that he preempted the Republican platform by continuing to deregulate the financial markets with the repeal of the Glass-Steagall Act that separated FDIC depositor-insured banking from higher risk investment banking, financing the addition of 100,000 more police to combat the drug epidemic, and downsizing poverty programs with welfare reforms that took tens of thousands off the welfare rolls, which required them to take low-paying menial jobs to receive even a limited amount of financial support.

The Republicans, as Chris Hedges said, were thus driven politically insane. They no longer had those bread and butter issues (such as law and order, smaller government) that were once their own, which led to formation of the Tea Party, and a new political civil war declared on Big Government ruled by the northern elite that had ruled for so long. It was our 150 year-old Civil War taking a new form, in other words, but with almost the same mix of combatants.

Hillary Clinton, unfortunately, wasn’t able to break away from the Clinton mix of conservative economics (e.g.,balancing the federal budget) and social liberalism that resulted. The culture wars against abortion, civil rights, and welfare (including Obamacare) were the only issues the Republican Party had left. The result was and is President-elect Trump, an ideologist of neither party. Trump is an advocate of no government, where possible, who can count on the loyalty of only his most trusted associates and family.

Sound familiar? It is politics of the tribe, the close=knit family, held by gangsters and Oligarchs, with everyone else to be treated with obfuscation and outright deceptions.

Even more significant is the record inequality since 1979, resulting from the loss of those policies that built up the middle class after WWII, policies from the New Deal, such as social security and Medicare, entitlements, unionization of whole industries, leading to the unparalleled prosperity of the 1950s and 60s.

So let us hope a majority of our politicians realize, as a majority of Americans still do, that our prosperity and stability rest on a middle class that hasn’t given up hope for a better life.

Harlan Green © 2016

Follow Harlan Green on Twitter: https://twitter.com/HarlanGreen
Posted in Consumers, Economy, Politics, Weekly Financial News | Tagged , , , , , , , , | Leave a comment

Boom Times In 2017 For Consumers?

Popular Economics Weekly

Here are more signs that economic growth will increase in 2017. There’s a large increase in revolving credit, one of the largest of the cycle, reports the Federal Reserve, a sign that retail sales are booming (with retails sales report due out Friday). And the National Federation of Independent Business reported its small business optimism index soared 7.4 points in December to 105.8, the highest reading since December 2004.

image

Graph: Econoday

Revolving credit jumped $11.0 billion in data for November to indicate that consumers are increasingly running up their credit-card debt. Non-revolving credit, up $13.5 billion, is also positive, here reflecting demand for vehicle financing and student loans (which are tracked in this report). Total credit rose $24.5 billion in the month, well above the consensus of economists. Retail sales for December, to be posted Friday as we said, will offer more definitive data on the strength of holiday spending.

The outsized increase in small business optimism far exceeds expectations and follows a robust 3.5-point rise in November. NFIB said business owners who expect better economic conditions accounted for about half of the overall increase, with a net 50 percent of respondents expecting that the economy will improve, a 38 point leap up from November. 

And even more importantly for small businesses, plans to increase capital spending jumped 5 points to 29. An increase in capital expenditures usually means increased productivity, a plus for increased economic growth. Earnings trends were also up 6 points, but remained in negative territory at minus 14, which is why more capex spending is so necessary to boost small business profits.

image

Graph: Calculated Risk

And lastly, the Labor Department just released its JOLTS report, the Job Openings and Labor Turnover Survey, which showed Jobs openings increased in November to 5.522 million from 5.451 million in October. Quits rose to 3.1 million (a sign more workers are finding better jobs), and new hires rose to 5.2 million.

This tells us the actual size of the U.S. jobs market that ‘churns’ so many millions of jobs every month, and which gives US the best picture of employment. The above graph shows job openings (yellow line), hires (dark blue), Layoff, Discharges and other (red column), and Quits (light blue column) from the JOLTS.

Over the month, hires and separations were also little changed at 5.2 million and 5.0 million. It is the difference between hires and separations that determines the actual number of new jobs created, says the Labor Department’s Bureau of Labor Stats (BLS).
The number of job openings (yellow) are up 6 percent year-over-year. This is big and says and says our economy continues to expand, but there aren’t enough skilled workers to fill those jobs. Quits are up 7 percent year-over-year. These are voluntary separations, as we said, and are the reason incomes are now rising faster than inflation.

What should we take away from this? No wonder it is so difficult to forecast future job trends. But with Job Openings some 300,000 more than actual Hires, U.S. businesses must find more ways to train and promote their own workforce.

Harlan Green © 2016

Follow Harlan Green on Twitter: https://twitter.com/HarlanGreen

Posted in Consumers, Economy, Uncategorized, Weekly Financial News | Tagged , , , , | Leave a comment