How We Lost Our Middle Class

Financial FAQs

We now have an even better reason to lament the decline of our middle class. New research by this year’s Nobel Prize winner in the Economic Sciences, Princeton Econ Prof Angus Deaton and his wife Anne Case, have revealed what happened to those 45-54 year-old high school educated whites that were once able to rise to the middle class when there were jobs that required more manual than mental skills (such as manufacturing jobs). They are dying in record numbers.

Drs. Deaton and Case discovered that incomes declined 19 percent and death rates increased 22 percent in households headed by someone with a high school education from 1999 to 2013; the higher death rates largely due to exploding suicide rates, and the abuse of drugs and alcohol.

This new study uncovers the disillusionment and ongoing depression of those that lost the most from globalization and overseas job flight—the least educated whites that once thought their jobs were guaranteed by the fact they were part of the ruling class.
image

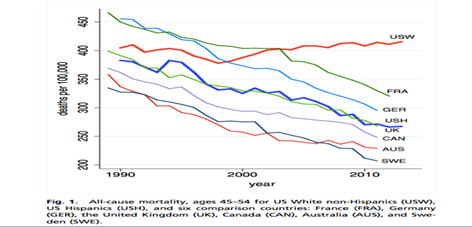
Graph: Krugman-NYTimes

This Paul Krugman graph shows the deaths from all causes for both white and Hispanic populations. The red line trending upward since 1990 is that of US White, non-Hispanics, vs. the declining blue line for US Hispanics. In other words, the US has the only (white) population of all developed countries whose death rates are increasing.

This truly horrific, new evidence of their plight might also highlight a reason for the flight of predominately white, lesser educated middle-aged males to the Tea Party that blames all government for their ills. It could also account for what goes with depression; an irrational opposition to any authority, which accounts for the popularity of Dr. Ben Carson and Donald Trump, in particular.

Yet opposition to any government programs has hurt this segment of society the most, as they are mostly situated in the poorest red states that need and depend on government transfer payments—such as social security, Medicare, Obamacare and food stamps.

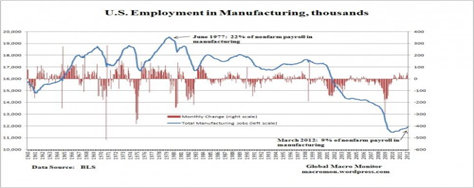
In fact, it has been too little government—the deregulation of whole industries which protected those jobs—that has allowed many jobs held by high school educated white in particular to migrate overseas, resulting in a decline of manufacturing jobs to 14 percent of employed workers from 22 percent in the 1960s.
image

Graph: Creditwritedowns.com

Big Business has almost always lobbied for freer trade (meaning lower tariffs), accompanied by fewer worker protections, as well as the ability to avoid U.S. taxes by keeping their foreign profits overseas. Then there was the demise of union collective bargaining, beginning with President Reagan’s firing of the PATCO Union traffic controllers that has led to some twenty-five right to work states where union membership is discouraged, union membership and dues aren’t required, so that employers are allowed to hire and fire their employees at will.

The result is business interests and their lobbyists have been able to keep the national minimum wage at $7.25 per hour (though individual cities and states are beginning to raise it). It has actually shrunk since 1968 when inflation is accounted for, which accompanies the greatest income inequality since the Great Depression

Today’s middle class entry-level jobs belong to computer and software engineers. The less educated are now victims of such income disparities. In fact, the overall current decline in middle class incomes and wealth can be explained as well. It was active government policies that intervened when and where the private sector wouldn’t with New Deal legislation that created our middle class after WWII, as I’ve said before.

image

Graph: New York Times

In the late 1960s, more than half of the households in the United States were squarely in the middle, says the New York Times. Middle class is considered to be earning in today’s dollars, $35,000 to $100,000 a year. Back then few people noticed or cared as the size of that group began to fall, because the shift was primarily caused by more Americans climbing the economic ladder into upper-income brackets.

But their share has been shrinking since 2000, to 43 percent of households today.

So the rise of income inequality highlighted by Professor Deaton is no accident. It has accelerated since the end of the Great Recession with such actions so that almost 100 percent of the income and wealth gain since 2008 has been garnered by the top 1 percent income bracket.

The study follows up on Dr. Deaton’s 2013 book, The Great Escape: Health, Wealth, and the Origins of Inequality, “a work that maps the origins of inequality and its fallout spanning 250 years of economic history in the world,” says a review of the book.

The result, as Professor Deaton predicted is the hurt to the middle-aged, high school educated has only grown. “There is a danger that the rapid growth of top incomes can become self-reinforcing through the political access that money can bring. Rules are set not in the public interest but in the interest of the rich, who use those rules to become yet richer and more influential.”

Harlan Green © 2015

Follow Harlan Green on Twitter: https://twitter.com/HarlanGreen
Posted in Consumers, Economy, Macro Economics, Politics, Weekly Financial News | Tagged , , , , , , | Leave a comment

Home Ownership Rate Increases, Thanks to Millennials

The Mortgage Corner

The Commerce Department just reported that homeownership rate rose to 63.7 percent in the third quarter, from 63.4 percent in the second quarter, reports the National Association of Realtors. That is still well below the high of the series, of 69.2 percent in the second quarter.

But things may be starting to change, as the home ownership rate for those under age 35—the so-called millennial generation of those aged 18 to 36–increased from 34.8 percent to 35.8 percent in the third quarter. That marks the largest gain for that population since the second quarter of 2004. Also, it was the only age cohort that posted a significant increase in the home ownership rate in the third quarter.

Why? They are the largest population generation, even topping their baby boomer parents in numbers. And many have been renting until now, but it looks like their job prospects have brightened, while rents are increasing some 8 percent per year due to the overall housing shortage. So why not take advantage of the tax deductions that come with home ownership?

Most economic forecasters have remained fairly optimistic about the job market for millennials in the coming years, reports the Wall Street Journal. The Federal Reserve and Congressional Budget Office, for example, expect the unemployment rate to continue to fall in the years ahead. In its most recent round of forecasts, the Fed thinks the jobless rate will settle in at between 5 percent and 5.2 percent. The CBO is somewhat less optimistic, projecting unemployment will fall a little further from where it is today, but that from 2018 to 2025 it will, on average, be a little bit higher than the Fed’s estimate, at about 5. percent.

“If the CBO or Fed are close to correct, the first 10 years for today’s graduating millennials would be the best for the entire generation so far,” says the WSJ.

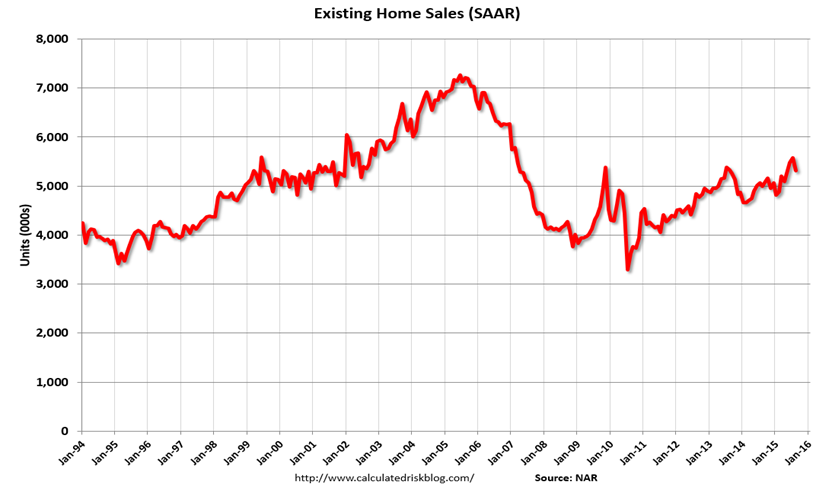
The result of the increase in home buying is that September existing-home sales soared to a 5.55 million rate, highest since 2007 at the end of the housing bubble. But this is putting pressure on inventories, as total housing inventory at the end of September decreased 2.6 percent to 2.21 million existing homes available for sale, and is now 3.1 percent lower than a year ago (2.28 million). Unsold inventory is at a 4.8–month supply at the current sales pace, down from 5.1 months in August.

image

Graph: Calculated Risk

This is much too low, and leaves many prospective homebuyers out of the market, especially at the lower-price, entry level. It is reflected in just released lower pending home sales for September. Pending home sales cooled for the second straight month and to their second lowest index reading in 2015, said the National Association of Realtors. All four major regions experienced a pullback in activity in September.

The Pending Home Sales Index, a forward–looking indicator based on contract signings, declined 2.3 percent to 106.8 in September from a slightly downwardly revised 109.3 in August but is still 3.0 percent above September 2014 (103.7). With last month’s decline, the index is now at its second lowest level of the year (103.7 in January), but has still increased year–over–year for 13 straight months.

Lawrence Yun, NAR chief economist, says a combination of factors likely led to September’s dip in contract signings. “There continues to be a dearth of available listings in the lower end of the market for first–time buyers, and Realtors in many areas are reporting stronger competition than what’s normal this time of year because of stubbornly–low inventory conditions,” he said. “Additionally, the rockiness in the financial markets at the end of the summer and signs of a slowing U.S. economy may be causing some prospective buyers to take a wait–and–see approach.”

And that is why the Federal Reserve just announced after its October FOMC meeting that it would not raise their interest rates. “The Committee continues to see the risks to the outlook for economic activity and the labor market as nearly balanced but is monitoring global economic and financial developments. Inflation is anticipated to remain near its recent low level in the near term but the Committee expects inflation to rise gradually toward 2 percent over the medium term as the labor market improves further and the transitory effects of declines in energy and import prices dissipate.”

NAR chief economist Lawrence Yun remains optimistic. “With interest rates hovering around 4 percent, rents rising at a near 8–year high, and job growth holding strong — albeit at a more modest pace than earlier this year — the overall demand for buying should stay at a healthy level despite some weakness in the overall economy.”

Most economic forecasters have remained fairly optimistic about the coming years. The Federal Reserve and Congressional Budget Office, for example, expect the unemployment rate to continue to fall in the years ahead. In its most recent round of forecasts, the Fed thinks the jobless rate will settle in at between 5 percent and 5.2 percent. The CBO is somewhat less optimistic, projecting unemployment will fall a little further from where it is today, but that from 2018 to 2025 it will, on average, be a little bit higher than the Fed’s estimate, at about 5.4%.

If the CBO or Fed are close to correct, the first 10 years for today’s graduating millennials would be the best for the entire generation so far. But aren’t the Fed and the CBO always wrong about the economy, you might ask? That’s a fair question. They haven’t done a good job predicting turning points, and they majorly missed the severity and length of damage from the 2007-09 recession.

It will be up to the millennial generation to push for economic and social policies that protect their interests, as with past generations.  Fortunately, a labor-friendly Federal Reserve under Janet Yellen is doing just that, in keeping interest rates this low.  It gives this largest adult generation a chance to gain that foothold so necessary for future prosperity.

Harlan Green © 2015

Follow Harlan Green on Twitter: https://twitter.com/HarlanGreen
Posted in Consumers, Economy, Housing, housing market, Weekly Financial News | Tagged , , , , , , , | Leave a comment

The Fed Can’t Raise Interest Rates Soon

The Mortgage Corner

Our Federal Reserve won’t be able to raise interest rates at all this year, or maybe even next year, says Marketwatch. Why? Because the EU Central Bank just announced they are increasing their Quantitative Easing program (QE), and that means the euro’s exchange rate will continue to fall.

Hence exports will be cheaper, helping their export industries (though imports are more expensive), while hurting ours in those industries that are in direct competition, such as the competition for airplane sales between Boeing and. Airbus.

“The logic is very simple, says Marketwatch’s Matthew Lynn. “While the ECB is still aggressively pumping money into the system, it is impossible for other central banks to tighten. Through the currency markets, it would wreak too much havoc on their own economies. And since it looks impossible for rates to rise in Europe any time soon, they are not going to rise anywhere else.”

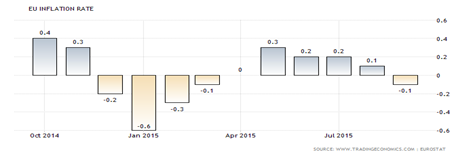
The EU Central Bank Chairman Mario Draghi is the culprit. He announced additional QE (Quantitative Easing) measures would be implemented, beginning in December, mainly because their retail inflation rate is back in negative territory. The inflation rate has been below the ECB’s 2 percent target since February of 2013.

At a press conference last week, he said the bank was exploring options for expanding QE. The bet in the markets is now that there will be more action in December, pumping more money into the system. If it doesn’t happen then, it probably will early in 2016.

image

Graph: Trading Economics

With inflation in negative territory, the ECB is far from its target of getting price growth to near 2 percent and its 60 billion euros ($66 billion) a month asset buys have proven insufficient as lower energy prices and slower growth in emerging economies have worked against it.

“Inflation is just not moving higher, there is a risk of falling into a Japanese-style liquidity trap,” said an ECB Governing Council member.

Doesn’t this sound like former Fed Chairman Ben Bernanke’s rationale when he announced the various U.S. QE purchase programs of government securities? And the result kept us from falling back into a recession, whereas the EU has had 2 recessions since 2008, and in danger of falling into a third, unless prices can be kept from falling further—i.e., into a deflationary spiral that Japan faced for one decade.

The euro has fallen more than 18 percent against the US Dollar, though its exchange rate is still a positive 1.11eu to the $1. It was as high as 1.35eu to the U.S. Dollar in 2014.

image

The EU is in this position because it didn’t move sooner to stimulate demand after the Great Recession. It was named so because it was a worldwide recession, for the most part, especially affecting the developed countries. Instead, the EU doubled down on austerity measures to reduce debt by cutting government spending. Greece was the poster child for profligacy and so has suffered the most from those austerity measures.

Draghi in his press conference said economic recovery and inflation in the eurozone were likely to be hit by slowing growth in emerging markets. “In this context, the degree of monetary policy accommodation will need to be re-examined at our December monetary policy meeting, when the new eurosystem staff macroeconomic projections will be available,” Draghi said at the meeting. He added that the Governing Council is “willing and able to act by using all the instruments available within its mandate.”

The emerging markets are especially hard hit with falling commodity prices hurting their resource industries. Brazil is in a full blown recession with negative GDP growth over the past 5 quarters, resulting in a – 2.6 percent annual growth rate in the second quarter 2015.

Harlan Green © 2015

Follow Harlan Green on Twitter: https://twitter.com/HarlanGreen

Posted in Economy, Keynesian economics, Macro Economics, Politics, Weekly Financial News | Tagged , , , , , , , | Leave a comment

Which Are Fastest Growing States?

Popular Economics Weekly

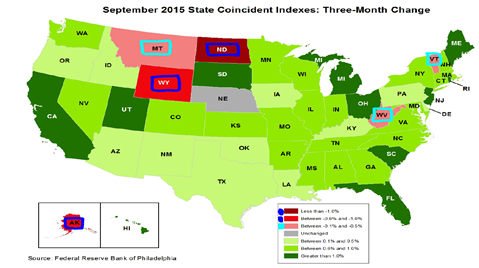
A very interesting report by the Philadelphia Fed is just out that surveys economic growth in all 50 states. And the report shows excellent growth continuing in most of the country as of September.

The Federal Reserve Bank of Philadelphia has released the coincident indexes for the 50 states for September 2015, indexes that measure near term growth. In the past month, the indexes increased in 41 states, decreased in six, and remained stable in three, for a one-month diffusion index of 70. Over the past three months, the indexes increased in 43 states, decreased in six, and remained stable in one, for a three-month diffusion index of 74.

image

Graph: Philadelphia Fed

This is firstly, a very good sign when 41 states show expanded growth. Secondly, the pink and red states are obviously coal or oil-driven economies, hence their downturn with the oil glut and falling energy prices in general may be temporary. Their economies were doing very well before energy prices declined, and in fact no states had negative growth as recently as December 2014, according to the Philadelphia Fed.

The coincident indexes combine four state-level indicators to summarize current economic conditions in a single statistic. They are nonfarm payroll employment, average hours worked in manufacturing, the unemployment rate, and wage and salary disbursements deflated by the consumer price index (U.S. city average). The trend for each state’s index is set to the trend of its gross domestic product (GDP), so long-term growth in the state’s index matches long-term growth in its GDP.

So the 10 fastest growing states (in dark green) that have grown more than 1 percent include California, Florida, South Carolina, and Maine. The worst performing states (red or pink) over the last 6 months are West Virginia (coal), North Dakota (oil), Alaska (oil), Wyoming, and Oklahoma (oil); obviously due to the drop in oil prices, as I’ve said.

California is an example of a fast growing state not dependent on the energy sector, due to Silicon Valley and its fast growing high tech industries. In fact, the California Legislative Analysts Office predicts something like a $10 billion budget surplus by the 2019-2020 fiscal year; maybe due to cheaper energy prices.

 image

Graph: CALAO

“As shown in the above graph, we project that operating surpluses will grow at a rate of between about $1 billion and $3 billion each year between 2014–15 and 2017–18, at which point we estimate that they will reach $9.6 billion under current laws and policies, says the LAO. “As the temporary taxes authorized by Proposition 30 phase out over several fiscal years near the end of our forecast period, we project that operating surpluses will remain stable as revenues and expenditures grow at similar rates. All this is premised upon our assumption of continuing economic growth through 2020.”

That is really the question, of course. Such projected growth means we remain in what I have called ‘goldilocks’ economic growth that is neither too hot (i.e. too much inflation), or too cold (too little inflation). And that will probably be up to Janet Yellen’s Fed, which is unwilling to raise interest rates this year, at least.

Harlan Green © 2015

Follow Harlan Green on Twitter: https://twitter.com/HarlanGreen
Posted in Consumers, Economy, Macro Economics, Weekly Financial News | Tagged , , , , , , , , , | Leave a comment

Best Existing-Home Sales Since 2007

Popular Economics Weekly

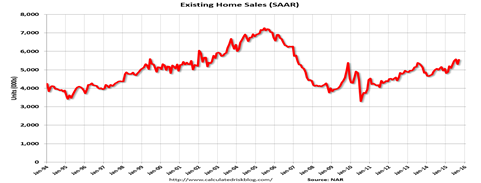
Total existing–home sales, which are completed transactions that include single–family homes, townhomes, condominiums and co–ops, increased 4.7 percent to a seasonally adjusted annual rate of 5.55 million in September from a slightly downwardly revised 5.30 million in August, and are now 8.8 percent above a year ago (5.10 million).

image

Graph: Calculated Risk

This is the best sales total since 2007. Total housing inventory at the end of September decreased 2.6 percent to 2.21 million existing homes available for sale, and is now 3.1 percent lower than a year ago (2.28 million). Unsold inventory is at a 4.8–month supply at the current sales pace, down from 5.1 months in August.

Lawrence Yun, NAR chief economist, says a slight moderation in home prices in some markets and mortgage rates remaining below 4 percent gave more households the confidence to close on a home last month. “September home sales bounced back solidly after slowing in August and are now at their second highest pace since February 2007 (5.79 million),” he said. “While current price growth around 6 percent is still roughly double the pace of wages, affordability has slightly improved since the spring and is helping to keep demand at a strong and sustained pace.”

“Despite persistent inventory shortages, the housing market has made great strides this year, backed by an increasing share of pent–up sellers realizing the increased equity they’ve gained from rising home prices and using it towards trading up or moving into a smaller home,” says Yun. “Unfortunately, first–time buyers are still failing to generate any meaningful traction this year.”

First–time buyers fell to 29 percent of sales in September after climbing to their highest share of the year in August (32 percent). This was the same as one year ago, when first–time buyers also represented 29 percent of all buyers.

It tells us several things. Firstly, it explains the surge in new-home construction, now up to 1.206 million units in September, and the rise in builder optimism to the highest level since 2005 and the beginning of the Great Recession.

Econoday reported that a strong gain in current sales gave a major boost to the housing market index which, coming in at 64 for October, topped Econoday’s high-end forecast for the highest reading since 2005. Current sales, the most heavily weighted component, rose 3 points to 70, strength that points to further gains for new home sales. Pointing to gains for permits and for future sales is a striking 7 point gain to 75 in expected sales six months from now.

Still slightly sub-par traffic, unchanged at a sub-50 level of 47, isn’t holding down sales, though the lack of traffic does point to lack of participation from first-time home buyers. Otherwise, this report is a standout for the housing outlook and will raise expectations for strength in tomorrow’s housing starts & permits report, which did rise.

The increase in sales and optimism is understandable with 30-year conforming fixed rates still at 3.50 percent, and so-called Hi-Balance conforming fixed at 3.625 percent (up to maximum $625,500 amount for single home in most counties) in California for less than one origination point.

Harlan Green © 2015

Follow Harlan Green on Twitter: https://twitter.com/HarlanGreen

Posted in Consumers, Housing, housing market, Weekly Financial News | Tagged , , , , , , | Leave a comment

Pending Sales, Housing Construction Are Healthy

The Mortgage Corner

Most of the Federal Reserve Governors have announced they don’t support raising interest rates until sometime next, year, and only if worldwide economic growth picks up. Why? The US Dollar is so strong that it’s hurting exports, and China and emerging markets aren’t importing much these days anyway, which hurts our growth.

So housing is leading our ongoing recovery at the moment. For instance, the NAR’s Pending Home Sales Index continues to grow. Though pending home sales retreated in August, they remained at a healthy level of activity and have now risen year–over–year for 12 consecutive months, according to the National Association of Realtors. A modest increase in the West was offset by declines in all other regions.

Lawrence Yun, NAR chief economist, says even with the modest decline in contract signings, demand continues to outpace housing supply and elevate price growth in numerous markets. “Pending sales have leveled off since mid–summer, with buyers being bounded by rising prices and few available and affordable properties within their budget,” he said. “Even with existing–housing supply barely budging all summer and no relief coming from new construction, contract activity is still higher than earlier this year and a year ago.”

The national median existing–home price is expected to increase 5.8 percent in 2015 to $220,300. Yun forecasts total existing–home sales this year to increase 7.0 percent to around 5.28 million, about 25 percent below the prior peak set in 2005 (7.08 million). Actually, that has already happened with August sales already at a 5.31m rate, which has to continue to achieve his annual total.

I wrote last week that Janet Yellen’s Fed delayed their announced rate raise in September because their growth projections for the rest of 2015 and beyond have been downgraded, since inflation is still too low for sustained growth. And now both the Fed and IMF are projecting a worldwide economic slowdown.

The Fed staff’s view was already gloomy. A mistaken leak this summer by the U.S. central bank revealed, before the Fed’s June policy committee meeting, potential growth averaging just 1.74 percent over 2015-2020, according to the document now on the Fed’s website. That’s down from an average growth rate of 3.1 percent over the past 50 years. Ordinarily, those predictions would not be released for 5 years, says the Fed.

image

Graph: Calculated Risk

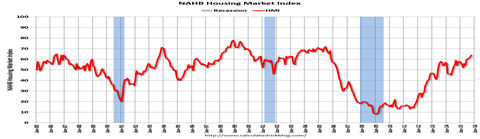
Even better housing news was that builder confidence in the market for newly constructed single-family homes rose three points in October to a level of 64 on the National Association of Home Builders/Wells Fargo Housing Market Index (HMI), according to the HAHB. This month’s reading is a return to HMI levels seen at the end of the housing boom in late 2005.

“With October’s three-point uptick, builder confidence has been holding steady or increasing for five straight months. This upward momentum shows that our industry is strengthening at a gradual but consistent pace,” said NAHB Chief Economist David Crowe. “With firm job creation, economic growth and the release of pent-up demand, we expect housing to keep moving forward as we start to close out 2015.”

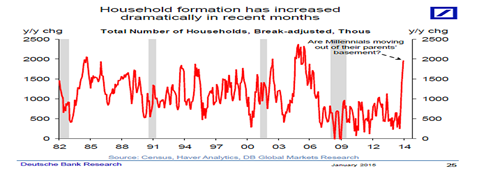
Housing construction has to catch up to more normal levels of approximately 1.2 million historical units per year from the current 1.09 million units. So there is still room for housing sales to grow, as household formation picks up (which is already happening, according to Deutsch Bank).

image

Graph: Deutsch Bank

This is even better news, needless to say.  Deutsche Bank predicts 1 million new households are being formed in 2015.  Millennials need dwellings as they continue to leave home and graduate from college. But much of new construction has to be in the moderate price ranges that we see in outlying areas. Even California has these regions in the southland and desert regions, mainly.

Harlan Green © 2015

Follow Harlan Green on Twitter: https://twitter.com/HarlanGreen
Posted in Consumers, Economy, Housing, housing market, Weekly Financial News | Tagged , , , , , , , , , | Leave a comment

Why the Q3 Slowdown Predictions?

Financial FAQs

The International Monetary Fund and the Federal Reserve have downgraded their estimates of growth in upcoming quarters. The IMF takes the worldwide view, with particular weakness in the emerging markets of Brazil, Nigeria, South Africa and Russia., and reduced demand in China for the commodities supplied by emerging market countries.

For the U.S., the IMF slightly raised its growth estimate by 0.1 percentage points to 2.6 percent this year amid a strong second-quarter rebound from an anemic first quarter marked by harsh winter weather and a West Coast ports slowdown. But IMF cut its U.S. projection to 2.8 percent from 3 percent for next year in light of deeper long-term headwinds for advanced economies generally, such as weak productivity growth, lower investment and aging populations.

The US Federal Reserve is also becoming less optimistic, due as well to the worldwide slowdown, but also to a hiring slowdown over the past couple of months. And retail sales seem to be slowing as well. Consumers seem to paying down debt, while eating out more, rather than buying things.

That’s probably why the U.S. Census Bureau announced today that advance estimates of U.S. retail and food services sales for September, adjusted for seasonal variation and holiday and trading-day differences, but not for price changes, increased just 0.1 percent from the previous month, and 2.4 percent above September 2014. The July 2015 to August 2015 percent change was revised from +0.2 percent to virtually unchanged.

image

Graph: Calculated Risk

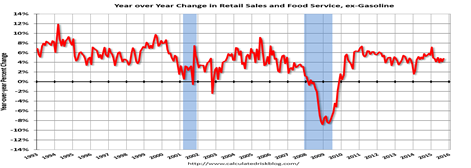
But wait a minute. Gas prices have plunged, so if always unpredictable gas prices are eliminated, the rest of sales including booming auto sales, plus Retail and Food service sales ex-gasoline increased by 4.8 percent on a YoY basis (2.4 percent for all retail sales including gasoline). That’s not such a bad figure with the holidays creeping in when sales always pick up.
Then why the doom and gloom about third quarter growth? Some economists are predicting below 1 percent GDP growth for Q3. For instance, the GDPNow model for real GDP growth (seasonally adjusted annual rate) in the third quarter of 2015 is 0.9 percent on October 14, down from 1.0 percent on October 9, says the Atlanta Federal Reserve. This is even though the model’s nowcast for real consumer spending growth in the third quarter fell from 3.6 percent to 3.2 percent after this morning’s retail sales report from the U.S. Census Bureau.

With consumer spending still good, such slow growth doesn’t make a lot of sense. Firstly, because the Atlanta Fed’s Lockhart has been the most consistently hawkish on inflation if the Fed doesn’t raise interest rates soon, and the lone dissenter of the latest Fed’s easy credit policies. So why suddenly does Lockhart now see essentially no growth in Q3, which means little or no inflation?

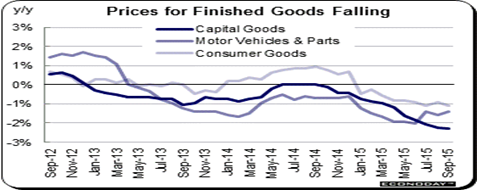
Another reason for reduced domestic expectations may be the huge drop in producer, or wholesale prices. The latest Producer Price Index plunged 0.5 percent, and has fallen 1.1 percent in a year. Exports remain very weak at minus 0.8 percent in the month following August’s 0.4 percent decline. September energy prices fell 5.9 percent and are down 23.7 percent year-on-year. Gasoline fell a monthly 16.6 percent for an almost incredible 42.8 percent year-on-year decline.

image

But that still doesn’t explain the prediction for a decline in aggregate, or overall demand. Non-manufacturing service sector growth is still strong at 55 percent, according to the Purchasing Managers indexes.

And Marketwatch’s Rex Nutting believes service industry prices are actually rising above the 2 percent inflation target, since they measure domestic demand, which is largely shielded from outside influences such as the Dollar’s value.

“For instance, the CPI excluding energy has risen 1.9 percent in the past year, right in the narrow range it’s been in for three years. And the prices of services excluding energy (which account for three-fifths of the consumer price index’s market basket) have risen 2.7 percent in the past year, matching the largest gain since 2008.”

Lael Brainard, one of the youngest Fed Governors, believes foreign trouble will weigh down future growth, and so has joined the chorus to hold down any rate increases until inflation is more obvious in a recent speech.

“There is a risk that the intensification of international cross currents could weigh more heavily on U.S. demand directly,” she said, “or that the anticipation of a sharper divergence in U.S. policy could impose restraint through additional tightening of financial conditions. For these reasons, I view the risks to the economic outlook as tilted to the downside. The downside risks make a strong case for continuing to carefully nurture the U.S. recovery–and argue against prematurely taking away the support that has been so critical to its vitality.”

Remarks such as Brainard’s with current low inflation is helping to keep interest rates at record lows. The 30-year fixed conforming rate has dropped to as low as 3.375 percent of late in California, which should help sustain economic growth. Much of the doom and gloom is due to predictions that Wall Street’s ‘salad’ days are over. I.e., stocks can’t go much higher, or interest rates much low—the 10-year T Bond yield today dropped to 1.90 percent—almost a historic low. So any reversal in these trends (higher rates, falling stock prices) could mean slower growth ahead.

But we don’t believe it with the holiday spending season coming up, and consumer confidence at post-recession highs, because consumers are in fact earning more money.

Harlan Green © 2015

Follow Harlan Green on Twitter: https://twitter.com/HarlanGreen
Posted in Consumers, Economy, Macro Economics, Politics, Weekly Financial News | Tagged , , , , | Leave a comment

When Will Fed Raise Interest Rates?

The Mortgage Corner

It has been puzzling many major economists, including Nobelist Paul Krugman, Obama advisor Larry Summers, and Minneapolis Fed Chair Narayan Kacherlakota, why Janet Yellen’s Fed is still talking about raising interest rates when current inflation numbers are so poor, as well as future growth projections.

image

Janet Yellen’s Fed delayed their announced rate raise in September because their growth projections for the rest of 2015 and beyond have been downgraded, since inflation is still too low for sustained growth. And now both the Fed and IMF are projecting a worldwide economic slowdown.

The Fed staff’s view was already gloomy. A mistaken leak this summer by the U.S. central bank revealed, before the Fed’s June policy committee meeting, potential growth averaging just 1.74 percent over 2015-2020, according to the document now on the Fed’s website. That’s down from an average growth rate of 3.1 percent over the past 50 years. Ordinarily, those predictions would not be released for 5 years, says the Fed.

In fact, the numbers are poor enough that the only beneficiaries of a rate rise at present would be Republican Presidential candidates, since past history shows economic growth would slow even more if interest rates were raised at this time of low inflation, and so favor the Republican Presidential candidate, whoever it may be.

And maybe that’s the reason Republicans continue to criticize anything the US Federal Reserve does, even though most economic growth since the Great Recession has been due to the Fed’s ultra-low low interest rates that has kept the cost of borrowing anything low. It could enhance their chances next November.

Even former Fed Chair Ben Bernanke has been irked by right wing conservatives for doing just the thing that most conservative economists, such as Martin Feldstein, and even arch-free market theorist Milton Friedman, said was the right thing to do during recessions—inject more money into the economy.

“[T]he increasing hostility of the Republicans to the Fed and to me personally troubled me, particularly since I had been appointed by a Republican president who had supported our actions during the crisis,” he said in his new book, The Courage To Act. “I tried to listen carefully and accept thoughtful criticisms. But it seemed to me that the crisis had helped to radicalize large parts of the Republican Party.”

“An aggressive Fed policy was the conservative alternative to the Keynesian idea that government spending and deficits were needed to counteract a severe economic recession,” says former George HW Bush Treasury official Bruce Bartlett. “But what happened is that the conservatives rejected both monetary and fiscal stimulus, in effect endorsing the “Austrian” view propounded by Friedrich Hayek and others that the government should do nothing and just let economic imbalances right themselves.”

But what is the Republican Party these days? In fact, there seem to be very few true conservatives left in the Republican Party. The definition of a conservative, after all, is to preserve the status quo, not to attempt to return to a distant past that never existed. And so what is left for the Republican Party to do if they can no longer agree on a viable policy to govern? Oppose governing itself.

In fact, Minnesota Fed President Kacherlakota believes interest rates could be dropped further to stimulate more growth in a recent speech. “I don’t see raising the target range for the fed funds rate above its current low level in 2015 or 2016 as being consistent with the pursuit of the kind of labor market outcomes that we are charged with delivering,” Kocherlakota said Thursday in remarks prepared for a speech in Mankato, Minnesota. “Indeed, I would be open to the possibility of reducing the fed funds target funds range even further, as a way of producing better labor market outcomes.”

Does future growth look very bad? We don’t think so, since cheaper goods and energy prices should help households and most businesses. Signs of slower growth would please Republicans, of course, who continue to maintain Democrats have done a lousy job of governing (in spite of a 5.1 percent US unemployment rate). How so, when the Republican alternative is not to govern at all?

Harlan Green © 2015

Follow Harlan Green on Twitter: https://twitter.com/HarlanGreen
Posted in Consumers, Economy, Macro Economics, Politics, Weekly Financial News | Tagged , , , , , , , , , , | Leave a comment

“Australia Is Not Like US”

Popular Economics Weekly

“Australia is not like the U.S.” said commentator Michael Pascoe in the Sydney Morning Herald in response to President Obama’s remarks on the Umpqua Community College killings by a deranged killer, whose mother kept at least 7 guns at home, in addition to the 8 guns plus ammunition carried by the shooter in the slaughter of college students and a teacher.

“We know that other countries in response to one mass shooting have managed to craft laws that almost eliminate mass shootings,” said President Obama. “Friends of ours, allies of ours, Great Britain, Australia, countries like ours.”

We happened to be in Australia while this happened, where the minimum wage for full-time, working adults is more than $16Aus per hour and Australian’s have created a health care system that pays for all normal health care costs (as opposed to catastrophic events), though hospital care is free for every Australian citizen.

In fact, the US now has a gun homicide rate 370 times that of Australia’s. “Unlike the US,” said Pascoe, “we collectively decided to have a decent social safety net, the concept of a living wage and make good education freely available. Most of us are wary of those with extreme views of any kind.”

Our gun problem of course extends beyond mass violence, says the LA Times. In 2014 alone, for example, the Centers for Disease Control and Prevention recorded 11,208 people shot to death, 33,636 injured by gunfire and 21,175 who killed themselves with a gun. That’s a total of 66,019 people who were killed or injured by a gun, which comes out to 1,269 per week, 180 a day or 7.5 per hour.

Current Australian gun laws were passed after 35 were killed and 23 wounded in 1996. There hasn’t been a mass shooting in Australia since. At the heart of the new laws was a massive buyback of more than 600,000 semi-automatic shotguns and rifles, or about one-fifth of all firearms in circulation in Australia. The country’s new gun laws prohibited private sales, required that all weapons be individually registered to their owners, and required that gun buyers present a “genuine reason” for needing each weapon at the time of the purchase, as well as a 28-day waiting period while backgrounds were checked. (Self-defense did not count.) In the wake of the tragedy, polls showed public support for these measures at upwards of 90 percent.

“The US is too immature a society to be allowed to play with guns,” said Pasco. “It has never shed its Wild West mythology. Americans still use their courts to kill people, which sends a message in its own way.”

What would cause the mother of the Umpqua college killer to have what can only be called a fanatical devotion to guns? “I keep all my mags full. I keep two full mags in my Glock case. And the ARs & AKs all have loaded mags. No one will be ‘dropping’ by my house uninvited without (acknowledgment),” the mother, wrote in her Tweety Bird tweet several years earlier, according to a CNN account.

It has been known for years by those who research gun violence that more gun killings occur in households owning guns. A new survey in the Annals of Internal Medicine narrows down some of the causal relationship between guns and death by finding conclusively that having a gun in your home makes you more likely to successfully attempt suicide. The authors of the survey also found with a lesser degree of certainty that people with guns in their home are more likely to be the victims of a homicide.

According to data gleaned from State and Justice departments for the period between 2001-2011, there have, in fact, been many, many more Americans killed by gun violence than by terrorism. During that 10-year period, some 130,347 have lost their lives to gun violence, compared to the approximately 3,000 Americans killed in acts of terrorism.

“It’s all fodder for the deranged fanatics of the American gun lobby, with a bible in one hand and an assault rifle in the other. It’s fuel for the paranoid interpretation of a line in the constitution that is a blatant anachronism.”

We have to be a very sick society to have allowed this to happen. We are so good at preventing foreign terrorists from attacking us, but not protecting Americans from domestic terrorists. Then we should understand that gun violence itself is an act of terror. And those that support unrestricted use and purchase of guns are the sponsors of domestic terrorism.

Harlan Green © 2015

Follow Harlan Green on Twitter: https://twitter.com/HarlanGreen
Posted in Economy, Politics, Uncategorized | Tagged , , , , , , , | Leave a comment

Single Payer “Universal” Health Plans, versus What?

Financial FAQs

We are in Australia, and my wife just paid for a General Practitioner’s visit to examine possibly dangerous sun damage to her skin. The Doctor’s examination cost her $37 Australian, and the topical medication just $10Au. So what is wrong with a health care system that functions so well, yet is mostly paid for by Australia’s taxpayers?

Perhaps it’s time to bust the myth that universal, or government-run, or ‘socialized’ medicine is somehow less desirable than the present U.S. system of private health insurance. We know the U.S. has the highest per capita health care costs in the developed world. So how does that make private health care that is owned and run by privately-owned health care providers (except for Medicare) more desirable?

It just isn’t true that total health expenditures – government plus private spending – is unsustainable. Australia spends about 9.5 percent of GDP on health services, for instance; the United States spends 17.7 percent. And even US spending, whether or not a good value for money, hasn’t undermined its economy or sapped the vitality of the country.

image

Graph: Washington Post

Australia has a government-run and insured health care system that covers every citizen cost free. And there was absolutely no waiting period in Australia’s fisth largest city, Adelaide, with the appointment scheduled just one day in advance.

The Physician my wife consulted said that the only drawback to the Australian system, in her opinion, was the difficulty of keeping the same General Practitioner, as there were some 44,000 GPs in Australia, and a patient had to see whoever was available at the time needed. Then what about our own Obamacare?

The Commonwealth Fund, a noted health care foundation, provides some of the best research on comparing national health plans and policies. And it maintains the U.S. Affordable Care Act will enable the U.S. to only begin to catch up with the rest of the developed world in not only health care benefits but global competitiveness, even though it still relies on private physicians and doesn’t regulate drug costs,.

“First, working-age Americans are sicker and die younger than citizens in many other developed countries,” say two researchers of the Commonwealth Fund. “This health disadvantage translates into a competitive disadvantage, as there is a well-documented relationship between workers’ health status and their productivity. The annual economic losses from diabetes and depressionalone are estimated to exceed $100 billion.

“The ACA could significantly improve the U.S. workforce’s overall health. Insurance expansions have been shown to improve beneficiaries’ health and raise their future earnings. Since the main coverage provisions of the law took effect, 12 million to 17 million working-age adults have gained health insurance. In addition, the ACA has stimulated a wave of innovations in health care, many focused on the things that keep us well, like prevention, telehealth, and promoting healthy lifestyles and living environments. To the extent that these succeed, the benefits will be felt in workforce productivity and business competitiveness.

“Second, taming our nation’s astronomical health care bill would further improve our ability to compete in foreign markets. We spend more on health care than any other wealthy country, as I said—health spending represents nearly one-fifth of the U.S. economy, compared with one-tenth in the average industrialized nation. This leaves fewer resources available for research, infrastructure, education, and other investments that are foundational to economic competitiveness. Warren Buffett went so far as to call our health system “the tapeworm, essentially, of the American economy.”

Another study by the Commonwealth Fund reported:

· The United States stands out for having the highest rates of chronic health conditions, such as diabetes and heart disease: 87 percent of older adults in the U.S. reported at least one chronic illness, and 68 percent reported two or more.

· Despite having Medicare coverage, U.S. adults age 65 or older were the most likely to report that cost posed a barrier to care. One-fifth (19 percent) said cost was the reason they did not visit a doctor, skipped a medical test or treatment recommended by a doctor, did not fill a prescription, or skipped doses.

· U.S. survey respondents were also the most likely to report trouble paying their medical bills (11 percent). Only 1 percent in Norway and Sweden reported the same.

So the U.S. Affordable Care Act is just a beginning in offering equivalent health care benefits of other developed countries. Yet many of our poorest red and southern states are refusing to expand their own health care coverage, though much of it will be paid for by the federal government. Hence they will remain our poorest states, with the greatest income inequality. Need we say more?

Harlan Green © 2015

Follow Harlan Green on Twitter: https://twitter.com/HarlanGreen
Posted in Consumers, Economy, Politics, Weekly Financial News | Tagged , , , , , | Leave a comment