We Need Some Inflation!

Financial FAQs

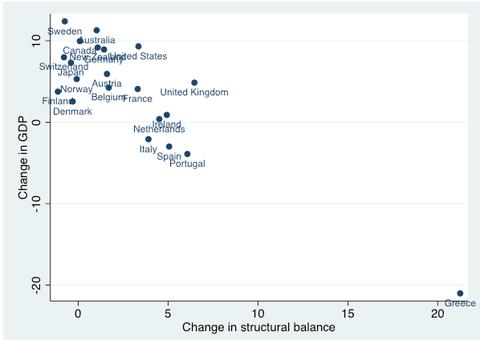
How much inflation is too much inflation? Germany thinks any inflation is too much, based on their 1920s inflation experience when burning money for fuel was cheaper than burning wood. It has led to the EU’s draconian austerity policies, such as calling for spending cuts during deflationary times that has kept the EU in and out of recessions since 2008.

euro

Trading Economics

Yet the US deficit hawks—mostly Republicans these days—continue to believe that deficits are evil and the Fed should begin to tighten now, rather than wait for 2015 when economic growth is more sustainable. This is even though the unemployment rate is 12.1 percent when the 3.1 million long term unemployed and part timers are included, and we have too little inflation.

inflation-1

Graph: Tim Duy

So how much is too much inflation? The easy answer is that rising prices become inflationary when supply can no longer meet the demand for goods and services over a prolonged period, thus raising prices. This last happened in the 1970s, when oil embargos were rampant, the rest of the world wasn’t yet industrialized and producing too much of everything, and trade barriers were higher than they are today.

In fact, we are in a world of generally falling prices with the Asian Tigers exporting most of what they produce, hence the huge surpluses. So maybe we should be looking at regional or worldwide prices and production capacities, instead of individual countries’? That seems to be Germany’s mistake, extrapolating its own past history to the EU as a whole.

Budget deficits don’t feed inflation during ‘zero-bound’ episodes (when interest rates are at, or close to 0 percent), such as after Great Recessions when all the Fed can do is try to prevent deflation, as occurred in Japan for two decades.

This is basic Economics 101 that many economists don’t understand, because they have little knowledge of liquidity traps—which is when money is no longer circulating, but being hoarded rather than invested. How could they, since it’s only happened twice in modern times—during the 1930s and now.

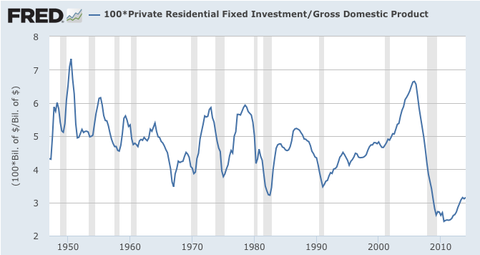
Budget deficits in fact prevent said deflationary episodes, which are episodes when wages are stagnant or falling and there is little or no economic growth, if the monies are spent wisely on longer term projects, because government spending puts more money into circulation. This should be easy to understand, but the inflation hawks are squawking again because the Fed now has some $4 trillion in reserves on its books, yet there is no inflation even on the horizon.

Calculated Risk has started an interesting discussion about when inflation might become a problem, using the US example. And it turns out that even US capacity utilization doesn’t give us a good measure. For instance, from 1992 to 2001 during the longest economic expansion in our history, when more than 20 million jobs were created and capacity utilization was as high as 84 percent of capacity, CPI prices averaged less than 3 percent. Maybe the Fed’s inflation target should be 3 rather than 2 percent, which has accompanied mostly weak growth.

capacity

Graph: Calculated Risk

So maybe we should be looking at the world’s production capacity when looking for the ideal inflation rate? Because China, Korea, and the other Asian Tigers continue to produce more than they consume, more ways should be found to boost demand, i.e., which in the majority are from mostly middle class incomes.

Oh wait a minute. That’s what we should be doing in the US as well. Maybe raising the Fed’s inflation target would boost demand, or are we as traumatized by the 1970’s era of stagflation as the German’s were in the 1920’s?

Harlan Green © 2014

Follow Harlan Green on Twitter: https://twitter.com/HarlanGreen

Posted in Consumers, Economy, Keynesian economics, Macro Economics, Politics, Weekly Financial News | Tagged , , , , , , , | Leave a comment

What is Yellen’s Real Unemployment Rate?

Financial FAQs

Fed Chairwoman Janet Yellen spoke with IMF President Christine Lagard at an epoch-making conference yesterday. It was epoch-making (with luminaries such a ex-Fed Chair Paul Volcker in attendance), because Ms. Yellen told us which unemployment rate she and the Fed Governors looked at to determine when they should begin to raise interest rates.

Though payrolls have averaged 231,000 additional jobs this year, the so-called U6 unemployment rate that includes people who can only find part-time work, including those who recently gave up looking, barely improved to 12.1 percent in June from 12.2 percent.

Yellen has said several times that it was specifically the long term unemployed that she wanted back to work before the Fed would seriously begin to tighten credit. The number of long-term unemployed (those jobless for 27 weeks or more) declined by 293,000 in June to 3.1 million, said the report. These individuals accounted for 32.8 percent of the unemployed. Over the past 12 months, the number of long-term unemployed has decreased by 1.2 million.

jobs

Graph: Marketwatch

This is when today’s June unemployment report was terrific, with the rate falling to 6.1 percent from 6.3 percent, and 288,000 payrolls jobs were created. There was hiring across the board. Even governments hired 26,000 additional employees.

Professional jobs increased by 67,000, just 15 percent of which were temp positions, said the report. Retailers hired 40,200 workers and restaurants added 33,000. Health-care providers, another source of steady hiring, created 21,000 new positions. Manufacturers took on 16,000 additional workers. Even the finance industry, which has lagged in hiring since the financial panic in 2008, created 17,000 jobs in June. That’s the largest increase in 27 months.

There is one other factor that Yellen, et. al., are looking at.  Wage and salary levels aren’t increasing faster than inflation, and the average workweek was unchanged at 34.5 hours. Hours worked tend to rise when an economy strengthens, but there’s been little change for months.

Average hourly pay rose 6 cents, or 0.2 percent to $24.45 in June. Over the past 12 months, wages have risen 2 percent. But wages are rising at just two-thirds the normal rate and the recovery is unlikely to be more robust unless workers start to receive bigger paychecks.

So Yellen and the Fed Governors are saying don’t tighten credit prematurely, as FDR did in 1937, which dragged the 30’s economy back into the Great Depression. There are still too many signs of weakness, including excessive long term unemployment and insufficient demand to warrant raising interest rates, or otherwise worry about inflation.

nutting

Graph: Marketwatch

Banks and Wall Street always worry about excessive inflation, because they are the creditors, and inflation reduces the value of their debt. But that benefits consumers, as it also reduces the value of their debt, and excessive consumer debt has been the main drag in this recovery.

So we will not see a real recovery that puts even the long term unemployed back to work, until the mountain of private debt is reduced. And that can’t happen until we create employment policies that continue to create more jobs on Main Street, rather than worry about and abet the policies of Wall Street.

Harlan Green © 2014

Follow Harlan Green on Twitter: https://twitter.com/HarlanGreen

Posted in Consumers, Economy, Keynesian economics, Macro Economics, Weekly Financial News | Tagged , , , , , , , | Leave a comment

Why Slow Recovery–It’s Housing, Stupid

Popular Economics Weekly

Dean Baker, a noted economist with the Center for Economic Policy and Research (NEPR), has probably given the best and most understandable reason for the Great Recession and ultra-slow recovery—it’s the lousy housing market.  The economy is growing at slightly over 2 percent, when we would expect 3 percent growth 5 years after the end of the Great Recession.

Image 

 “The basic story of the Great Recession is about as simple as they come,” says Baker.  “The economy was being driven by a housing bubble and the bubble burst. The combination of the loss of housing construction, due to the enormous overbuilding of the bubble years, and the loss of the consumption that had been driven by bubble generated housing wealth, created a gap in annual demand of more than $1 trillion. That’s all simple and easy.”

So the weak housing market, even with the Fed doing all it can do to keep interest rates at rock bottom, hasn’t boosted US growth sufficiently to approach full employment.  Why?  The housing market would be recovering sooner if government was allowed to do more, because of austerity policies prevalent both here and in Europe.   And the results are easy to see in this Paul Krugman graph. 

Image           

Graph: Paul Krugman

Those countries with the lowest growth rates have the most stringent austerity measures—i.e., most drastic budget cuts and highest interest rates when government should be keeping interest rates as low as possible.  And they are the United Kingdom, Spain, Portugal and Greece, of course.  But the US isn’t far behind, in line with France that is having its own budget problems.

What should be done?  We know the government has to help, either with mortgage relief (buy up the bad mortgages and hold them until the market improves), or buying the underwater housing as was done during the Great Depression, and selling them back when conditions improved.

            The Home Owners’ Loan Corporation was set up in 1933 under the New Deal.  It made more than one million loans to homeowners, sometimes bought the underwater homes, and otherwise supported homeowners who were behind on their payments.  Sound familiar?

Image

Graph: FHFA

 The HARP and HAMP loan programs were current attempts to do the same and they have refinanced 3 million of the 16 million homes guaranteed by Fannie Mae and Freddie, according to The Housing Wire and FHFA, the Federal Housing Finance Authority that supervises Fannie and Freddie.

But 8 million more homes are eligible, according to the FHFA, and the White House has done little to promote HARP 3.0, a newer version that would loosen qualification standards to increase eligibility for those behind on their payments, which would allow more homes to be refinanced.  So it doesn’t look like another New Deal for housing is in the offing.

“…what did economists think would fill a trillion dollar gap in annual spending?” laments Baker.  “Of course the government could do it with more spending and/or tax cuts, but since we have a religious cult in Washington that says it is better to keep millions out of work than to run deficits, this was a political impossibility.”     

Harlan Green © 2014

Follow Harlan Green on Twitter: https://twitter.com/HarlanGreen

Posted in Uncategorized | Leave a comment

Pending Home Sales Up—A Better 2014?

The Mortgage Corner

Is the housing market finally beginning to thaw from the polar winter? Pending home sales rose sharply in May, with lower mortgage rates and increased inventory accelerating the market, according to the National Association of Realtors’ Pending Home Sales Index (PHSI). All four regions of the country saw increases in pending sales, with the Northeast and West experiencing the largest gains.

Housing inventories are now up 14 percent, June-to-June, according to Housing Tracker (Department of Numbers). The median asking price for existing homes is now $280, 935, up 10.2 percent y-o-y. But in high growth areas, such as San Francisco and San Jose, inventories are shrinking -1.5 percent and -0.7 percent, respectively thanks to a booming Silicon Valley. Existing inventories in Los Angeles have not grown at all y-o-y.

inventory

Graph: Calculated Risk

NAR chief economist Lawrence Yun expects improving home sales in the second half of the year. “Sales should exceed an annual pace of five million homes in some of the upcoming months behind favorable mortgage rates, more inventory and improved job creation,” he said. “However, second-half sales growth won’t be enough to compensate for the sluggish first quarter and will likely fall below last year’s total.”

firsttimers

Graph: Marketplace.org

That’s in part because only 29 percent of prospective homebuyers were first-timers, and first-timers usually take up at least 33 percent of purchases. Many first-timers are more likely to rent than purchase at present, with little or no savings and difficult qualification criteria, say several surveys.

FHA in particular has tightened its standards and costs. The upfront mortgage insurance fee (MIP) is now 1.75 points, and annual premium 1.5 points with the minimum 3.5 percent down payment. It is slightly less for higher down payments. FHA at one time accounted for up to 60 percent of first-time homebuyers, but now it’s just 30 percent.

Will this change soon? It will depend mainly on better-paying jobs. And that depends on fuller employment, which seems to be the best way to boost incomes these days.

“The flourishing stock market the last few years has propelled sales in the higher price brackets, while sales for homes under $250,000 are 10 percent behind last year’s pace. Meanwhile, apartment rents are expected to rise 8 percent cumulatively over the next two years because of tight availability,” said Yun. “Solid income growth and a slight easing in underwriting standards are needed to encourage first-time buyer participation, especially as renting becomes less affordable.”

The PHSI in the Northeast jumped 8.8 percent to 86.3 in May, and is now 0.2 percent above a year ago. In the Midwest the index rose 6.3 percent to 105.4 in May, but is still 6.6 percent below May 2013. Pending home sales in the South advanced 4.4 percent to an index of 117.0 in May, and is 2.9 percent below a year ago. The index in the West rose 7.6 percent in May to 95.4, but remains 11.1 percent below May 2013.

Yun expects existing-homes sales to be down 2.8 percent this year to 4.95 million, compared to 5.1 million sales of existing homes in 2013. The national median existing-home price is projected to grow between 5 and 6 percent this year and in the range of 4 to 5 percent in 2015.

Harlan Green © 2014

Follow Harlan Green on Twitter: https://twitter.com/HarlanGreen

Posted in Consumers, Housing, housing market, Weekly Financial News | Tagged , , , , , , | Leave a comment

Austerity Must End With Q1 GDP Plunge

Popular Economics Weekly

The final Q1 2014 GDP growth estimate of minus (-2.9) percent, down from the second (-1) percent drop, was a shock for several reasons. Firstly, it means our domestic economy is still sputtering, five years after the end of the Great Recession. Secondly, it means it will take more than Janet Yellen’s accommodative Fed to boost economic growth to a sustainable level.

And lastly, austerity policies that have basically frozen economic growth since then have to end. By that we mean those policies that have lowered tax revenues and limited government spending for too long. They have literally been counter-productive, and hobbled economic growth.

gdp.jpg

Graph: Trading Economics

Average economic growth over the past 4 quarters has dipped to just 2 percent, mainly because Q1 personal consumption dipped to 1 percent from its initial 3.1 percent estimate. And inventories weren’t replenished, maybe due to the horrid winter. But government outlays also shrank, not due to the weather, contributing to the growth shrinkage.

depression

What should be done? More government investment in public works, for starters. It was New Deal government-funded programs that brought US out of the Great Depression by 1933. It only retrenched back into the Depression when Congress and FDR decided to balance the budget in 1937 by cutting back prematurely on government spending.

Growth came back quickly by 1939 with just a small increase in New Deal spending. Though it took WWII to complete the recovery when government had to spend what was necessary to win the war. The budget deficit wasn’t an issue—though it rose as high as 120 percent of GDP—because government debt was paid down quickly after WWII from rising consumer incomes and spending.

Today we do not have rising middle class incomes due to many causes, including globalization of the workforce, regulations that make restrict collective bargaining and make it easier to fire workers. So as during the Great Recession, government has to create those jobs that would lower the jobless rate and boost consumers’ incomes again.

The evidence that public works programs boost growth is plain for all to see. Even the 2009 American Reinvestment and Recovery Act (ARRA) stimulus created or saved up to 3 million jobs, according to the Congressional Budget Office.

The lack of public spending today is due to budget austerity—cutting government spending prematurely when the private sector isn’t yet prepared to spend—something that is afflicting European countries as well as US. It is preventing faster growth everywhere that such budget cutting policies have been enacted.

In fact, Europe plunged back into a second recession because its northern contingent led by Germany insisted on cutting the budgets of Greece, Spain, and Ireland. This reduced their revenues and increased their deficits, plunging them back into recession. So the only way they could compete in the euro zone was to lower workers’ incomes, further compounding the pain.

Austerity has happened in the US with a conflicted president and Congress that won’t utilize the $billions sitting in banks and on corporate balance sheets by either increasing their taxes, or borrowing more at record low interest rates. It is those who oppose higher taxation and government spending that is bringing US closer to 1937. Hence the debt ceiling debacle that downgraded US federal debt.

govt

Graph: Calculated Risk

And right now, it is specifically the lack of government spending (red bar on graph) on necessary public works that is holding by GDP growth. In other words, we are in the grip of those same Austerians that insist the cure is more pain for the heavily indebted, instead of creating more jobs that would pay down that debt by restoring growth and full employment.

The Fed has tried to putting more cash in the hands of investors to encourage them to invest in more productive capacity, which is finally boosting residential investment (blue bar on graph). But the looming end of QE3 by year end will end that support of lower Treasury and mortgage rates. So it is time for Congress and the Obama Administration to act, if we want to prevent a return to depression-era growth, as happened in 1937.

Harlan Green © 2014

Follow Harlan Green on Twitter: https://twitter.com/HarlanGreen

Posted in Consumers, Economy, Keynesian economics, Macro Economics, Politics, Weekly Financial News | Tagged , , , , , , , | Leave a comment

Will Housing Now Lead the Recovery?

The Mortgage Corner

There is still hope that housing may help this economic recovery, as it has in past recoveries. But that is only if Fed Chairman Janet Yellen succeeds in keeping interest rates—mortgage rates in particular—at their current low, or even lower as they were last spring.

Total existing-home sales, which are completed transactions that include single-family homes, townhomes, condominiums and co-ops, rose 4.9 percent to a seasonally adjusted annual rate of 4.89 million in May from an upwardly-revised 4.66 million in April, according to the National Association of Realtors, but remain 5.0 percent below the 5.15 million-unit level in May 2013.

EXISTING

Graph: Calculated Risk

This means interest rates do affect housing sales. April 2013 was the last month for record low conforming rates, before then Fed Chairman Bernanke announced the Fed would begin to ‘taper’ their $85 billion per month QE3 purchase of Treasury and mortgage-backed securities that helped housing prices begin their rebound from the Great Recession.

There had been a flurry of refinance business and purchase transactions until then, as homeowners scrambled to take advantage of 3.25 to 3.50 percent fixed rates for conforming loan amounts insured by Fannie Mae or Freddie Mac.

MBA

Graph: WSJ Marketwatch

Further evidence the reduction in QE3 purchases drove up interest rates is that the overall decline in originations has been led by the refinancing index, which  declined by 74.5 percent (dotted red line in graph) since the week of May 3, 2013 and the announcement of the tapering (which actually didn’t begin until fall 2013), while the purchase index has declined by 19 percent.

But housing prices are still rising, as the April S&P/Case-Shiller 20-city composite measure of home prices rose 1.1 percent in April, though the year-on-year gains decelerated to 10.8 percent, according to data released today. Las Vegas and San Francisco led the way with + 18 percent increases, and San Diego, Detroit and Miami were close behind with 15 percent annual increases.

Another reason that prices rises are slowing (other than from higher mortgage rates) may also be that housing inventories are surging. Inventory in 2014 (Red) is now 13.6 percent above the same week in 2013, as reported by Ben at Housing Tracker (Department of Numbers).

housetracker

Graph: Calculated Risk

So what has to happen to maintain the housing recovery? It looks like mortgage rates must stay at their current level. Today, the 30-year conforming fixed rate is back down to 4 percent for 0 origination points in California, at least. This is mainly thanks to Janet Yellen, who keeps maintaining that rates have to stay low long enough to create jobs for the long term unemployed.

She can do this because she is an authentic macro economist, one who understands how our real economy works in order to put people back to work. This may be the first time that a Fed Chairman has said full employment is more important than bankers’ worry about inflation (which is still nonexistent, by the way).

In fact, full employment is the cure that will bring back household income, and pay down the federal debt, something that real economists know, but that bankers and corporate executives seem to have forgotten.

Harlan Green © 2014

Follow Harlan Green on Twitter: https://twitter.com/HarlanGreen

Posted in Consumers, Economy, Housing, housing market, Macro Economics, Weekly Financial News | Tagged , , , , , , , , , , , , , | Leave a comment

When is Higher Inflation Good?

Financial FAQs

The short answer is that higher inflation comes from higher growth rates, and so when an economy expands faster, then prices should also rise faster. Otherwise companies’ profits don’t rise and they won’t want to expand their businesses and so hire more workers.

But pundits and some economists keep focusing on the expectations of future inflation, even when current conditions don’t warrant such expectations. It’s as if those folks are afraid of faster growth, when that is exactly what is needed. Everyone, including the IMF and Federal Reserve in its latest update, believes US GDP growth will average no more than 2 percent this year.

gdp

Graph: Trading Economics

This is a pitiful growth rate, and we know why this is happening. Consumers, though they have paid their debt down to pre-Great Recession levels, aren’t earning any more money after inflation. Earnings are also increasing just 2 percent.

And governments aren’t generating more jobs that only governments can generate—such as in public infrastructure, education (more teachers), research and development that pays for future growth, and environmental protection that must mitigate some of the effects of global warming, such as the thousands of miles of US coastline affected by rising oceans.

That is the gist of Janet Yellen’s pronouncements after yesterday’s FOMC meeting. We must allow inflation to rise above the 2 percent level with the PCE inflation index used by the Fed.

PCE

Graph: Econoday

Year-on-year Personal Consumption Expense prices are increasing at plus 1.6 percent and 1.4 percent for the core without food and energy prices.  While inflation is still below the Fed goal of 2 percent, it has been firming in recent months.

But Fed Chair Yellen suggested that growth was too slow to worry about incipient inflation, which meant the Fed wouldn’t have to raise rates for some time to come. That’s because the central bank expected 1.5 to 1.7 percent inflation in 2014, nearly identical to their forecast in March and a level below their target.

inflation

Graph: WSJ Marketwatch

Responding to a later question, she said: “For the moment, I don’t see any trade-off whatsoever in achieving our two objectives (growth with stable inflation). They both call for the same policy, namely, a highly accommodative monetary policy.”

Then who is actually worrying about inflation? Hardly anyone, including the Fed Governors. So the answer is that higher inflation is a good thing when it’s necessary to boost higher growth, which in turn will create more jobs, which is turn boosts more growth. So it is low inflation–and low inflation expectations–that is the problem to be solved. Why should anyone fear a higher growth rate?

Harlan Green © 2014

Follow Harlan Green on Twitter: https://twitter.com/HarlanGreen

Posted in Consumers, Economy, Macro Economics, Politics, Weekly Financial News | Tagged , , , , , , , , | Leave a comment

Will Housing Starts Pick Up?

The Mortgage Corner

“An uptick in single-family permits was probably the most important feature of a May residential construction report that was otherwise somewhat softer than our forecast,” says the research firm, Wrightson ICAP. Total housing starts fell 6 percent to a level of 1.001 million, reversing about half of a 13 percent April jump. Construction fell in three out of the four regions, but were up in the South.

The reason was overall permits fell 6 percent, or about twice as much as Wrightson had expected, reflecting a nearly 20 percent decline in the multi-family component. That left those permits at a four-month low, but “we are not too concerned with the decline, which looks to be a correction for a very strong April showing in this always-volatile sector,” said Wrightson.

starts

Graph: Calculated Risk

The standout number in today’s report was the 4 percent rise in single-family permits to a six-month high of 619,000. After hitting a recovery high of 645,000 in November, single-family permits had been stuck in a tight range of 593K to 600K over the last four months. The breakout in May, along with the jump in the NAHB Builder Optimism index to 49 in June, seems to suggest that single-family activity could be about emerge from its recent doldrums over the next few months.

confidence

Graph: Calculated Risk

Builder confidence in the market for newly built, single-family homes rose four points in to reach a level of 49 in the National Association of Home Builders/Wells Fargo Housing Market Index (HMI) released yesterday. It remains one point shy of the threshold for what is considered good building conditions.

“Consumers are still hesitant, and are waiting for clear signals of full-fledged economic recovery before making a home purchase,” said NAHB Chief Economist David Crowe. “Builders are reacting accordingly, and are moving cautiously in adding inventory.”

One reason consumers are cautious is because interest rates have risen slightly, though the 30-year conforming fixed rate is still low, at 4 percent with 0 origination points in California. The Federal Reserve added more fuel to the controversy after yesterday’s FOMC meeting and Fed Chairman Janet Yellen’s press conference, when Yellen said short term rates could now rise sooner in 2015.

But the Fed also revised its growth predictions downwards, which would have the opposite effect—that of holding down interest rates longer! In fact, just two days after the International Monetary Fund revised its 2014 growth estimates for the U.S. economy from 2.8 percent to 2 percent, FOMC members revised down their estimates from a range of 2.8 to 3 percent in March to 2.1 percent to 2.3 percent following this most recent FOMC meeting. But the Fed maintained its 3 percent growth estimate for 2015.

So I predict such a low growth rate will not push up interest rates, at all. In fact, mortgage rates in particular could even drift lower by the end of this year, unless the housing market—construction in particular—picks up.

Harlan Green © 2014

Follow Harlan Green on Twitter: https://twitter.com/HarlanGreen

Posted in Consumers, Housing, housing market, Weekly Financial News | Tagged , , , , , , | Leave a comment

Why Have a Higher Minimum Wage?

Popular Economics Weekly

The International Monetary Fund just came out with a depressing prognosis for US economic growth—2 percent this year, and maybe 3 percent next year? Why? A too bad winter, slowdown in the housing market, and stagnant wages.

gdp

Graph: Trading Economics

But both housing and economic growth in general are dependent on growing incomes. So we need a higher minimum wage, for starters. Some of the richest cities are doing that. Seattle raised its minimum wage to $11 per hour. But overall household incomes aren’t rising faster than inflation, and congressional Republicans are resisting any raises, even though it would benefit the poorest states they control.

In fact, both household incomes and inflation are also rising just 2 percent per year, when they would need to rise 3 to 4 percent to boost growth and lower the unemployment rate further, currently 6.3 percent.

We only have to look to countries with a higher minimum wage to see what a difference it makes. Australia’s minimum wage is now $16.37 per hour for fully employed adults, and will rise 3 percent in July 2014, whereas ours is still $7.25 per hour, nationally. And so Australia’s growth rate is averaging 3.5 percent per year. If we achieved that growth rate again, social security would be solvent as far as we can look into the future, say economists.

australia

Graph: Trading Economics

More evidence that higher wages stimulate growth comes from comes from many sources, including Thomas Piketty’s Capital in the Twenty-First Century, that documents 2 centuries of income and wealth transfers, and the return to historical levels of income inequality that is hurting economic growth.

And a new paper argues inequality is not only bad for those at the bottom. It is also bad for economic growth as a whole and a major reason why the recovery from the Great Recession has been so weak.

It is synopsized in a Washington Post article that attacks inequality vs. economic growth directly. Barry Z. Cynamon and Steven M. Fazzari, economists working with the Weidenbaum Center on the Economy, Government and Public Policy at Washington University in St. Louis, say that stagnant income for the “bottom 95 percent” of wage earners makes it impossible for them to consume as they did in the years before the downturn.

fredgraph

Graph: St. Louis Fed

Consumer spending which drives 70 percent of the U.S. economy, dropped sharply during the recession (gray column in graph). And while it has picked back up in the years since for the top 5 percent of wage earners — which the Census Bureau defines as households making more than $166,000 a year — “there is no evidence of a recovery whatsoever for the bottom 95 percent,” Fazzari said.

Raising the minimum wage isn’t the best answer, of course. Creating programs that promote more jobs is the best answer to boosting wages and salaries of the 95 percent. And that has to start with government that needs to replace and repair our ageing roads, bridges, and all public infrastructure, for starters.

That’s because our private sector banks and corporations are still hoarding their cash reserves, or sending them overseas. It’s more than $5 trillion at last count, and that means a real loss of wealth and jobs for those Americans that need it most.

Harlan Green © 2014

Follow Harlan Green on Twitter: https://twitter.com/HarlanGreen

Posted in Consumers, Economy, Housing, Macro Economics, Weekly Financial News | Tagged , , , , , , | 1 Comment

Home Sizes Ballooning Again

The Mortgage Corner

Housing sizes are ballooning, after a slight pause due to the Great Recession, reports the U.S. Census Bureau and Marketwatch. In 2013 the median floor area of new single-family homes sold in the U.S. rose 4 percent to hit almost 2,500 square feet, according to recently released data from the U.S. Census Bureau.

That compares to the median 1,800-square-foot size of a single detached home, as reported in the 2011 American Housing Survey, when 40 percent of homes were 1-2,000 square feet in size.

largehomes

Graph: WSJ Marketwatch

The biggest new single-family homes of all were sold in the South, hitting a median of 2,534 square feet in 2013, up 1 percent from the prior year. Homes in the Northeast reached 2,456 square feet, up 3 percent. Homes in the Midwest measured 2,405 square feet, up 9 percent from 2012, and homes in the West hit 2,394 square feet, up 5 percent.

And prices continue to rise. The Case-Shiller Home Price Index of same-home sales has risen 12.4 percent in a year, and buyers are paying more for these larger homes. The median sales price of new single-family homes rose to $268,900 last year, up 10 percent from 2012.

What does that say? Those with the money are moving the various markets. The fastest growing segment are homes from 3,000 to 3,999 square feet, says the Census Bureau. Last year 9 percent of new single-family homes sold in the U.S. were at least 4,000 square feet, up from 8 percent in 2012. Meanwhile, the share of homes under 1,800 square feet fell to 17 percent in 2013, down from 22 percent in 2012 and 33 percent a decade earlier.

Existing-home sales are following the same trend. April’s sales of existing homes that cost at least $1 million grew more than 5 percent from a year earlier, while sales of homes under $250,000 fell more than 5 percent, according to the National Association of Realtors.

What will bring more buyers into the housing market? Even lower mortgage rates, it seems. Purchase mortgage applications are still declining since January, even though mortgage rates have plunged on late, with the 30-year conforming fixed rate falling to 3.875 percent, and Hi-Balance conforming fixed rates at 4.00 percent for 1 origination point.

mortgages

Graph: WSJ Marketwatch

So the big question remains whether middle class families will be able to afford those middle class homes anymore? That has as much to do with households starting up, or new household formation. And with so many of the 25 to 55 year-olds out of work, it may take years for households formation to pick up to the 1.2m per year average that prevailed before the Great Recession, from the current 600,000 new annual households being formed.

workers

Graph: Zero Hedge

For instance, in the April unemployment report, one of the most important age group for jobs, those workers aged 25-54 which represent the bulk of the US labor force and are also the best and most productive group, the total number of jobs tumbled from 95,360K to 95,151K, a drop of 209K, reports Zero Hedge.

Seniors were the winners. According to the establishment survey, the only beneficiary of whatever this jobs “recovery” is, were workers aged 55-69, that have gained 174,000 jobs to date.

Harlan Green © 2014

Follow Harlan Green on Twitter: https://twitter.com/HarlanGreen

Posted in Consumers, Housing, housing market, Weekly Financial News | Tagged , , , , , | Leave a comment