Will Housing Now Lead the Recovery?

The Mortgage Corner

There is still hope that housing may help this economic recovery, as it has in past recoveries. But that is only if Fed Chairman Janet Yellen succeeds in keeping interest rates—mortgage rates in particular—at their current low, or even lower as they were last spring.

Total existing-home sales, which are completed transactions that include single-family homes, townhomes, condominiums and co-ops, rose 4.9 percent to a seasonally adjusted annual rate of 4.89 million in May from an upwardly-revised 4.66 million in April, according to the National Association of Realtors, but remain 5.0 percent below the 5.15 million-unit level in May 2013.
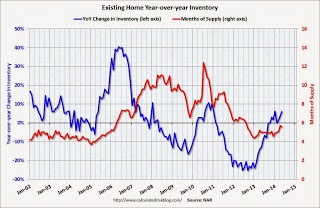
EXISTING

Graph: Calculated Risk

This means interest rates do affect housing sales. April 2013 was the last month for record low conforming rates, before then Fed Chairman Bernanke announced the Fed would begin to ‘taper’ their $85 billion per month QE3 purchase of Treasury and mortgage-backed securities that helped housing prices begin their rebound from the Great Recession.

There had been a flurry of refinance business and purchase transactions until then, as homeowners scrambled to take advantage of 3.25 to 3.50 percent fixed rates for conforming loan amounts insured by Fannie Mae or Freddie Mac.
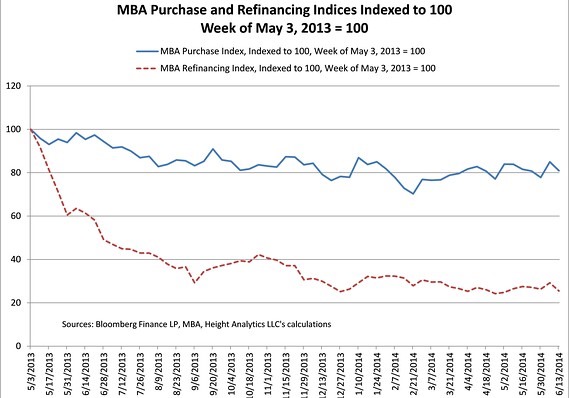
MBA

Graph: WSJ Marketwatch

Further evidence the reduction in QE3 purchases drove up interest rates is that the overall decline in originations has been led by the refinancing index, which  declined by 74.5 percent (dotted red line in graph) since the week of May 3, 2013 and the announcement of the tapering (which actually didn’t begin until fall 2013), while the purchase index has declined by 19 percent.

But housing prices are still rising, as the April S&P/Case-Shiller 20-city composite measure of home prices rose 1.1 percent in April, though the year-on-year gains decelerated to 10.8 percent, according to data released today. Las Vegas and San Francisco led the way with + 18 percent increases, and San Diego, Detroit and Miami were close behind with 15 percent annual increases.

Another reason that prices rises are slowing (other than from higher mortgage rates) may also be that housing inventories are surging. Inventory in 2014 (Red) is now 13.6 percent above the same week in 2013, as reported by Ben at Housing Tracker (Department of Numbers).
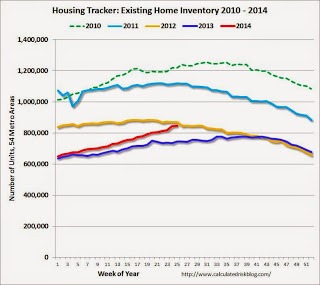
housetracker

Graph: Calculated Risk

So what has to happen to maintain the housing recovery? It looks like mortgage rates must stay at their current level. Today, the 30-year conforming fixed rate is back down to 4 percent for 0 origination points in California, at least. This is mainly thanks to Janet Yellen, who keeps maintaining that rates have to stay low long enough to create jobs for the long term unemployed.

She can do this because she is an authentic macro economist, one who understands how our real economy works in order to put people back to work. This may be the first time that a Fed Chairman has said full employment is more important than bankers’ worry about inflation (which is still nonexistent, by the way).

In fact, full employment is the cure that will bring back household income, and pay down the federal debt, something that real economists know, but that bankers and corporate executives seem to have forgotten.

Harlan Green © 2014

Follow Harlan Green on Twitter: https://twitter.com/HarlanGreen

Posted in Consumers, Economy, Housing, housing market, Macro Economics, Weekly Financial News | Tagged , , , , , , , , , , , , , | Leave a comment

When is Higher Inflation Good?

Financial FAQs

The short answer is that higher inflation comes from higher growth rates, and so when an economy expands faster, then prices should also rise faster. Otherwise companies’ profits don’t rise and they won’t want to expand their businesses and so hire more workers.

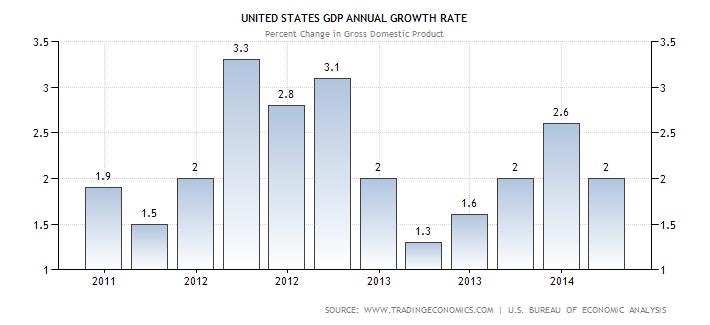
But pundits and some economists keep focusing on the expectations of future inflation, even when current conditions don’t warrant such expectations. It’s as if those folks are afraid of faster growth, when that is exactly what is needed. Everyone, including the IMF and Federal Reserve in its latest update, believes US GDP growth will average no more than 2 percent this year.

gdp

Graph: Trading Economics

This is a pitiful growth rate, and we know why this is happening. Consumers, though they have paid their debt down to pre-Great Recession levels, aren’t earning any more money after inflation. Earnings are also increasing just 2 percent.

And governments aren’t generating more jobs that only governments can generate—such as in public infrastructure, education (more teachers), research and development that pays for future growth, and environmental protection that must mitigate some of the effects of global warming, such as the thousands of miles of US coastline affected by rising oceans.

That is the gist of Janet Yellen’s pronouncements after yesterday’s FOMC meeting. We must allow inflation to rise above the 2 percent level with the PCE inflation index used by the Fed.

PCE

Graph: Econoday

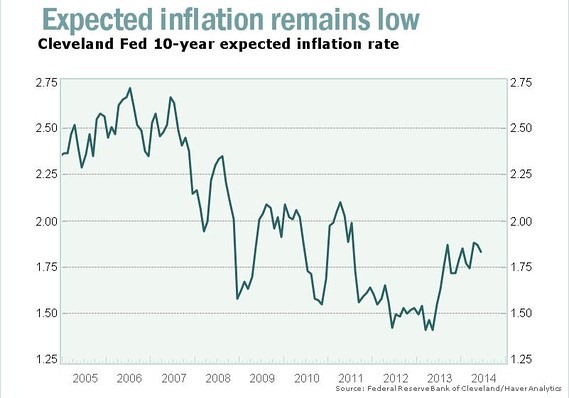
Year-on-year Personal Consumption Expense prices are increasing at plus 1.6 percent and 1.4 percent for the core without food and energy prices.  While inflation is still below the Fed goal of 2 percent, it has been firming in recent months.

But Fed Chair Yellen suggested that growth was too slow to worry about incipient inflation, which meant the Fed wouldn’t have to raise rates for some time to come. That’s because the central bank expected 1.5 to 1.7 percent inflation in 2014, nearly identical to their forecast in March and a level below their target.

inflation

Graph: WSJ Marketwatch

Responding to a later question, she said: “For the moment, I don’t see any trade-off whatsoever in achieving our two objectives (growth with stable inflation). They both call for the same policy, namely, a highly accommodative monetary policy.”

Then who is actually worrying about inflation? Hardly anyone, including the Fed Governors. So the answer is that higher inflation is a good thing when it’s necessary to boost higher growth, which in turn will create more jobs, which is turn boosts more growth. So it is low inflation–and low inflation expectations–that is the problem to be solved. Why should anyone fear a higher growth rate?

Harlan Green © 2014

Follow Harlan Green on Twitter: https://twitter.com/HarlanGreen

Posted in Consumers, Economy, Macro Economics, Politics, Weekly Financial News | Tagged , , , , , , , , | Leave a comment

Will Housing Starts Pick Up?

The Mortgage Corner

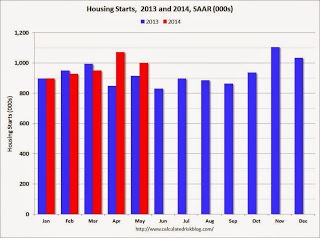
“An uptick in single-family permits was probably the most important feature of a May residential construction report that was otherwise somewhat softer than our forecast,” says the research firm, Wrightson ICAP. Total housing starts fell 6 percent to a level of 1.001 million, reversing about half of a 13 percent April jump. Construction fell in three out of the four regions, but were up in the South.

The reason was overall permits fell 6 percent, or about twice as much as Wrightson had expected, reflecting a nearly 20 percent decline in the multi-family component. That left those permits at a four-month low, but “we are not too concerned with the decline, which looks to be a correction for a very strong April showing in this always-volatile sector,” said Wrightson.

starts

Graph: Calculated Risk

The standout number in today’s report was the 4 percent rise in single-family permits to a six-month high of 619,000. After hitting a recovery high of 645,000 in November, single-family permits had been stuck in a tight range of 593K to 600K over the last four months. The breakout in May, along with the jump in the NAHB Builder Optimism index to 49 in June, seems to suggest that single-family activity could be about emerge from its recent doldrums over the next few months.

confidence

Graph: Calculated Risk

Builder confidence in the market for newly built, single-family homes rose four points in to reach a level of 49 in the National Association of Home Builders/Wells Fargo Housing Market Index (HMI) released yesterday. It remains one point shy of the threshold for what is considered good building conditions.

“Consumers are still hesitant, and are waiting for clear signals of full-fledged economic recovery before making a home purchase,” said NAHB Chief Economist David Crowe. “Builders are reacting accordingly, and are moving cautiously in adding inventory.”

One reason consumers are cautious is because interest rates have risen slightly, though the 30-year conforming fixed rate is still low, at 4 percent with 0 origination points in California. The Federal Reserve added more fuel to the controversy after yesterday’s FOMC meeting and Fed Chairman Janet Yellen’s press conference, when Yellen said short term rates could now rise sooner in 2015.

But the Fed also revised its growth predictions downwards, which would have the opposite effect—that of holding down interest rates longer! In fact, just two days after the International Monetary Fund revised its 2014 growth estimates for the U.S. economy from 2.8 percent to 2 percent, FOMC members revised down their estimates from a range of 2.8 to 3 percent in March to 2.1 percent to 2.3 percent following this most recent FOMC meeting. But the Fed maintained its 3 percent growth estimate for 2015.

So I predict such a low growth rate will not push up interest rates, at all. In fact, mortgage rates in particular could even drift lower by the end of this year, unless the housing market—construction in particular—picks up.

Harlan Green © 2014

Follow Harlan Green on Twitter: https://twitter.com/HarlanGreen
Posted in Consumers, Housing, housing market, Weekly Financial News | Tagged , , , , , , | Leave a comment

Why Have a Higher Minimum Wage?

Popular Economics Weekly

The International Monetary Fund just came out with a depressing prognosis for US economic growth—2 percent this year, and maybe 3 percent next year? Why? A too bad winter, slowdown in the housing market, and stagnant wages.

gdp

Graph: Trading Economics

But both housing and economic growth in general are dependent on growing incomes. So we need a higher minimum wage, for starters. Some of the richest cities are doing that. Seattle raised its minimum wage to $11 per hour. But overall household incomes aren’t rising faster than inflation, and congressional Republicans are resisting any raises, even though it would benefit the poorest states they control.

In fact, both household incomes and inflation are also rising just 2 percent per year, when they would need to rise 3 to 4 percent to boost growth and lower the unemployment rate further, currently 6.3 percent.

We only have to look to countries with a higher minimum wage to see what a difference it makes. Australia’s minimum wage is now $16.37 per hour for fully employed adults, and will rise 3 percent in July 2014, whereas ours is still $7.25 per hour, nationally. And so Australia’s growth rate is averaging 3.5 percent per year. If we achieved that growth rate again, social security would be solvent as far as we can look into the future, say economists.

australia

Graph: Trading Economics

More evidence that higher wages stimulate growth comes from comes from many sources, including Thomas Piketty’s Capital in the Twenty-First Century, that documents 2 centuries of income and wealth transfers, and the return to historical levels of income inequality that is hurting economic growth.

And a new paper argues inequality is not only bad for those at the bottom. It is also bad for economic growth as a whole and a major reason why the recovery from the Great Recession has been so weak.

It is synopsized in a Washington Post article that attacks inequality vs. economic growth directly. Barry Z. Cynamon and Steven M. Fazzari, economists working with the Weidenbaum Center on the Economy, Government and Public Policy at Washington University in St. Louis, say that stagnant income for the “bottom 95 percent” of wage earners makes it impossible for them to consume as they did in the years before the downturn.

fredgraph

Graph: St. Louis Fed

Consumer spending which drives 70 percent of the U.S. economy, dropped sharply during the recession (gray column in graph). And while it has picked back up in the years since for the top 5 percent of wage earners — which the Census Bureau defines as households making more than $166,000 a year — “there is no evidence of a recovery whatsoever for the bottom 95 percent,” Fazzari said.

Raising the minimum wage isn’t the best answer, of course. Creating programs that promote more jobs is the best answer to boosting wages and salaries of the 95 percent. And that has to start with government that needs to replace and repair our ageing roads, bridges, and all public infrastructure, for starters.

That’s because our private sector banks and corporations are still hoarding their cash reserves, or sending them overseas. It’s more than $5 trillion at last count, and that means a real loss of wealth and jobs for those Americans that need it most.

Harlan Green © 2014

Follow Harlan Green on Twitter: https://twitter.com/HarlanGreen
Posted in Consumers, Economy, Housing, Macro Economics, Weekly Financial News | Tagged , , , , , , | 1 Comment

Home Sizes Ballooning Again

The Mortgage Corner

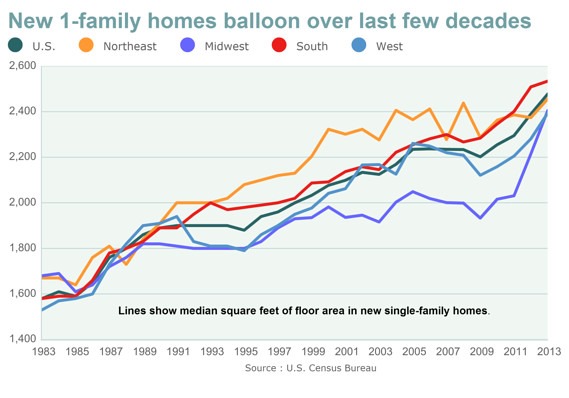
Housing sizes are ballooning, after a slight pause due to the Great Recession, reports the U.S. Census Bureau and Marketwatch. In 2013 the median floor area of new single-family homes sold in the U.S. rose 4 percent to hit almost 2,500 square feet, according to recently released data from the U.S. Census Bureau.

That compares to the median 1,800-square-foot size of a single detached home, as reported in the 2011 American Housing Survey, when 40 percent of homes were 1-2,000 square feet in size.

largehomes

Graph: WSJ Marketwatch

The biggest new single-family homes of all were sold in the South, hitting a median of 2,534 square feet in 2013, up 1 percent from the prior year. Homes in the Northeast reached 2,456 square feet, up 3 percent. Homes in the Midwest measured 2,405 square feet, up 9 percent from 2012, and homes in the West hit 2,394 square feet, up 5 percent.

And prices continue to rise. The Case-Shiller Home Price Index of same-home sales has risen 12.4 percent in a year, and buyers are paying more for these larger homes. The median sales price of new single-family homes rose to $268,900 last year, up 10 percent from 2012.

What does that say? Those with the money are moving the various markets. The fastest growing segment are homes from 3,000 to 3,999 square feet, says the Census Bureau. Last year 9 percent of new single-family homes sold in the U.S. were at least 4,000 square feet, up from 8 percent in 2012. Meanwhile, the share of homes under 1,800 square feet fell to 17 percent in 2013, down from 22 percent in 2012 and 33 percent a decade earlier.

Existing-home sales are following the same trend. April’s sales of existing homes that cost at least $1 million grew more than 5 percent from a year earlier, while sales of homes under $250,000 fell more than 5 percent, according to the National Association of Realtors.

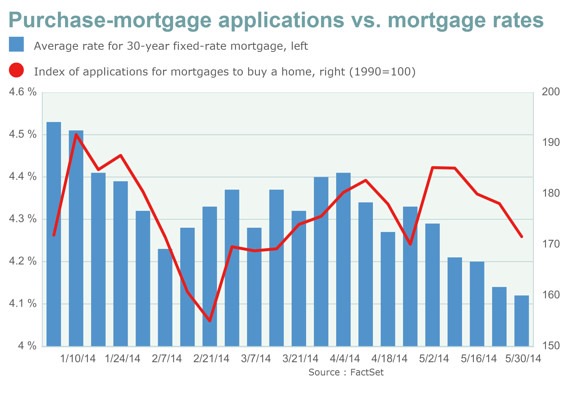
What will bring more buyers into the housing market? Even lower mortgage rates, it seems. Purchase mortgage applications are still declining since January, even though mortgage rates have plunged on late, with the 30-year conforming fixed rate falling to 3.875 percent, and Hi-Balance conforming fixed rates at 4.00 percent for 1 origination point.

mortgages

Graph: WSJ Marketwatch

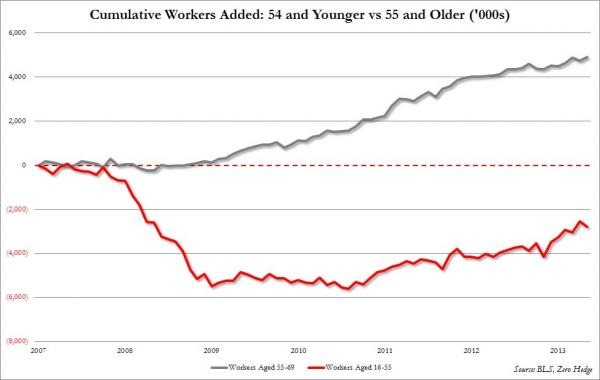
So the big question remains whether middle class families will be able to afford those middle class homes anymore? That has as much to do with households starting up, or new household formation. And with so many of the 25 to 55 year-olds out of work, it may take years for households formation to pick up to the 1.2m per year average that prevailed before the Great Recession, from the current 600,000 new annual households being formed.

workers

Graph: Zero Hedge

For instance, in the April unemployment report, one of the most important age group for jobs, those workers aged 25-54 which represent the bulk of the US labor force and are also the best and most productive group, the total number of jobs tumbled from 95,360K to 95,151K, a drop of 209K, reports Zero Hedge.

Seniors were the winners. According to the establishment survey, the only beneficiary of whatever this jobs “recovery” is, were workers aged 55-69, that have gained 174,000 jobs to date.

Harlan Green © 2014

Follow Harlan Green on Twitter: https://twitter.com/HarlanGreen

Posted in Consumers, Housing, housing market, Weekly Financial News | Tagged , , , , , | Leave a comment

What is Employment Like in 2014?

Popular Economics Weekly

Jobless claims fell sharply in the May 24 week, down 27,000 to 300,000. The 4-week average is down a very sharp 11,250 to a new recovery low of 311,500. It should mean we will see a further drop in the May unemployment rate out this Friday from 6.3 percent to 6 percent or below. This is huge and could mean continuing debate on the wisdom of the Fed holding down short term interest rate into 2015, when the US might already be at full employment.

The conventional wisdom is that a rate in the 5 percent range means all that are looking for work should be able to find decent paying jobs. But because so many have dropped out of the workforce—some 2 million at last count—they aren’t included in the numbers. In fact, including those working part time or that have left the workforce but are still able to work, would boost the unemployment rate to some 11 percent.

jobless

Graph: Calculated Risk

Continuing claims are also down, falling 17,000 in lagging data for the May 17 week to a new recovery low of 2.631 million. The 4-week average is down 33,000 to 2.655 million, also a recovery low. The unemployment rate for insured workers, also at a recovery low, held steady at 2.0 percent.

The real reason the Labor Department’s unemployment rate isn’t accurate shows up best in the labor participation rate. The percentage of population working has dropped to the lowest level in more than 20 years.

population

Graph: Calculated Risk

The Labor Force Participation Rate (blue line in graph) was decreased in April to 62.8 percent. This is the percentage of the working age population in the labor force.  The participation rate is well below the 66 percent to 67 percent rate that was normal since 1978, really, although a significant portion of the recent decline is due to demographics.

April’s nonfarm payrolls rose 288,000 jobs, and that is the number looked at by most economists. It is based on an Establishment survey of actual companies, whereas the unemployment rate is a much small telephone survey of workers, which therefore includes the self-employed.

So whether it’s due to more retiring workers, or a shrinking population of eligible workers, or getting the discouraged workers back to work, it’s going to be more difficult to achieve real full employment in this recovery. And that is why I am predicting we will have low interest rates and a housing market still in recovery mode for a long time to come.

Harlan Green © 2014

Follow Harlan Green on Twitter: https://twitter.com/HarlanGreen
Posted in Consumers, Economy, Housing, housing market, Weekly Financial News | Tagged , , , , , | Leave a comment

T Piketty and Capital Beyond the 21st Century

Popular Economics Weekly

Thomas Piketty’s Capital in the 21st Century is about more than proving that excessive income and wealth inequality has been the norm over centuries by so-called free market capitalism, or its social democratic versions in Europe. It’s also about how future generations might share in that wealth, and hence what capitalism must look like in future centuries, if it is to survive.

For it has to be no surprise that capital growth must exceed economic growth, and so earnings, for a country to be able to feed all its citizens. Because the whole system is built upon creating enough excess to invest in order to expand future growth. That is why the capitalist system was created. That excess is called profits; or the amount of capital above and beyond operating expenses, including wages and salaries. And companies need to invest most of their profits in expanding their output, if they hope to survive.

Piketty’s contention is that capital has to be taxed in some way to guarantee a more equal distribution of its benefits for future generations, so as to avoid some of the risks inherent in more unequal wealth distribution—such as Great Recessions, Depressions, or rising levels of crime and social dysfunction as enumerated in Richard Wilkinson and Katie Pickett’s The Spirit Level.

There are several forms this can take. Nobel economist Robert Shiller has proposed inequality insurance as an answer to the propensity of capitalist systems to accumulate its wealth in fewer hands. This is insurance that governments could set up to redistribute the excess wealth being created under capitalism.

“Inequality insurance would require governments to establish very long-term plans to make income-tax rates automatically higher for high-income people in the future if inequality worsens significantly, with no change in taxes otherwise,” says Dr. Shiller, as an example. “I called it inequality insurance because, like any insurance policy, it addresses risks beforehand. Just as one must buy fire insurance before, not after, one’s house burns down, we have to deal with the risk of inequality before it becomes much worse and creates a powerful new class of entitled rich people who use their power to consolidate their gains.”

The “entitled rich people” have already begun to counterattack Piketty’s research data that he has posted online. They mainly contest his assertion that income and wealth inequality is built into the current capitalist systems. Chris Giles, Economics Editor of the Financial Times, even asserts that in Europe there hasn’t been any inequality, historically. Even though he doesn’t challenge Piketty’s main thesis, that historical returns on capital have outpaced the growth in wage and salary, and even overall economic and population growth.

Conservatives have to be looking out of another window, if they are trying to refute his data, though Giles doesn’t challenge Piketty’s conclusion for the US economy. It has the highest level of inequality of all developed countries per the CIA’s World Factbook, higher even than many developing countries.

For instance, we know that US corporate CEOs’ average CEO-to-worker pay ratio in 2012 was about 350 to 1. In 1960, the average chief executive earned 40 times as much as the average worker. By 1990, the average CEO earned 107 times as much. In the following decade, this ratio rose to 525:1 before settling back to 301:1 in 2003, after the 1991 recession.

That’s in part because average household incomes have been stagnant since 1980 after inflation, whereas the top 1 percent’s earnings have skyrocketed—garnering some 96 percent of total US national income generated since the end of the Great Recession.

British economist Andrew Smithers observes in his new book, “The Road to Recovery,” one of the reasons. Stock-related bonuses for executives encourage them to make decisions that boost their share prices in the short term, rather than in the long term. The result is that they spend corporate capital less on long-term investments, which will set their companies up for future profit, and more on shoveling dividends to investors, which props up their shares quarter by quarter.

And that is the very antithesis of what the capitalist system was created to do. Otherwise it is just benefiting the few vs. the many, as we said. For instance, Smithers observed American companies devoted 15 times as much capital to investments as they disbursed to shareholders, until the 1990s. Today the ratio is less than 2 to 1. And we know the top 25 hedge fund managers earned some $24.3 billion in 2013, according to Forbes Magazine.

So will the capitalist systems we know today survive? And if so, in what form, or is there a better, more equitable, economic system we cannot yet see?

Harlan Green © 2014


Follow Harlan Green on Twitter: https://twitter.com/HarlanGreen

Posted in Economy, Macro Economics, Uncategorized, Weekly Financial News | Tagged , , , , , , , | Leave a comment

Where Is Housing Affordable Anymore?

Financial FAQs

How much salary do you need in order to afford the principal and interest payments on a median-priced home in your metro area? To find out, HSH.com, a mortgage data service, took the National Association of Realtors’ first-quarter data for median home prices and HSH.com’s first-quarter average interest rate for 30-year, fixed-rate mortgages to determine how much of your salary it would take to afford the base cost of owning a home–the principal, interest, taxes and insurance–in 27 metro areas.

hsh

Graph: HSH

The good news is that conforming 30-yr fixed rates are now down to 3.875 percent for a ½ origination point in California. The Hi-Balance conforming 30-yr fixed rate is now 4 percent with a ½ pt. origination fee.

Residents of the five cities that need the lowest annual salary to afford a median-priced home were: Cleveland ($29,788), Pittsburgh ($30,177), St. Louis ($31,275), Cincinnati ($31,850) and Detroit ($32,250). The five least-affordable cities were: Boston ($79,820) Los Angeles ($85,964) New York City ($89,788), San Diego ($98,534) and San Francisco ($137,129).

Unfortunately, HSH used very conservative debt-to-income (DTI) ratios to arrive at these numbers, making them seem more sensational that they really were. HSH used standard 28 percent “front-end” debt ratios, and a 20 percent down payment taken from the NAR’s median-home-price data to arrive at their figures, said the blog. But Fannie Mae allows up to 45 percent for all debt, and even 50 percent DTI, in some cases, so that homes even in the most expensive cities don’t require such high salaries.

A buyer can in fact own a home that is 160 percent higher than the median prices with the same income, or conversely, instead of the $137,150 annual salary, it can be as low as $103,000 per year with San Francisco’s $679,800 median price, if no other debt obligations.

This is while April total existing-home sales, which are completed transactions that include single-family homes, townhomes, condominiums and co-ops, rose 1.3 percent to a seasonally adjusted annual rate of 4.65 million in April from 4.59 million in March, but are 6.8 percent below the 4.99 million-unit level in April 2013.

inventory

Graph: Calculated Risk

Total housing inventory at the end of April jumped 16.8 percent to 2.29 million existing homes available for sale, which represents a 5.9-month supply at the current sales pace, up from 5.1 months in March. Unsold inventory is 6.5 percent higher than a year ago, when there was a 5.2-month supply, which is slowing those price increases.

Homes are still affordable, even in the highest-priced cities, in other words. But it’s no surprise those are the coastal cities that also have the most robust economies.

Harlan Green © 2014

Follow Harlan Green on Twitter: https://twitter.com/HarlanGreen

Posted in Consumers, Economy, Housing, housing market, Weekly Financial News | Tagged , , , , , , , | Leave a comment

New-Home Construction, Permits Soar

The Mortgage Corner

Housing starts jumped in April and building permits hit their highest level in nearly six years, offering hope the weak housing market could be stabilizing, according to the US Census Bureau’s April report on housing starts.  This means more homes will be available to make up for the current inventory shortage, the lowest inventory of homes for sale since early 2000.

Groundbreaking for homes surged 13.2 percent to a seasonally adjusted annual pace of 1.07 million units, the highest since November 2013, the Commerce Department said. Ground-breaking for single family homes rose 0.8 percent, while starts for the volatile multi-family homes segment surged 39.6 percent.

The housing starts report suggested building activity would likely continue to rise for some time, according to Inside Debt, as permits to build homes jumped 8.0 percent to a 1.08 million unit pace in April. Permits for single family homes, however, rose just 0.3 percent. Permits for multifamily housing soared 19.5 percent.

icap

Graph: ICAP

A separate report showed consumer sentiment falling in May on worries over income growth, tempering the housing data’s upbeat signal on the economy. The news has been good but not consumer sentiment which has softened noticeably so far this month, to 81.8 vs 84.1 in final April and 82.6 vs mid-month April. The latest reading is below the low estimate in the Econoday forecast.

Weakness is split evenly between the composite’s two components with expectations down 1.5 points from final April to 73.2 and with current conditions down to 95.1 which is 3.6 points below final April and which signals specific monthly weakness for the run of consumer data for May.

sentiment

Graph: Econoday

Gas prices are steady and are not affecting inflation expectations which remain stable to lower, at 3.2 percent for 1-year expectations which is unchanged from final April and at 2.8 percent for 5-year expectations which is down 1 tenth.

It’s hard to explain the fall off in this report, says Econoday. Job indications are strong led by the big bounce higher in the April employment report and followed by two straight weeks of significant declines in jobless claims. The stock market is making new records and housing prices are strong so far in 2014, two factors that add to consumer wealth. So we see consumer confidence continuing to improve this year as consumers feel more wealthy with a steadily improving housing market.

Harlan Green © 2014

Follow Harlan Green on Twitter: https://twitter.com/HarlanGreen
Posted in Consumers, Housing, housing market, Weekly Financial News | Tagged , , , , | 1 Comment

New Fannie, Freddie Regulator Won’t Cut Loan Limits

The Mortgage Corner

WASHINGTON (MarketWatch) — This headline just out.  Mortgage-finance giants Fannie Mae and Freddie Mac won’t be directed to lower the limits for mortgages that they back, the new head of their federal regulator said Tuesday. In a departure from his predecessor, Mel Watt, director of the Federal Housing Finance Agency, is generally seen as favoring efforts to maintain borrowers’ access to credit, rather than focusing on winding down the government sponsored enterprises.

This is terrific news for the housing market, needless to say. One of the first actions by President Obama’s appointee to run the Federal Housing Finance Authority (FHFA) is to make it easier for home borrowers and buyers to obtain conforming mortgages—mortgages that are guaranteed by Fannie Mae and Freddie Mac, and which comprise more than 60 percent of mortgages issued these days.

The conforming limits will therefore still be $417,000 for the best conforming rates—3.875 percent with 1 origination point for 30-year fixed rates in California today—and $625,500 for so-called Hi-Balance conforming loans—now at 4.125 percent for 0 points origination in California.

“This decision is motivated by concerns about how such a reduction could adversely impact the health of the current housing finance market,” Watt said Tuesday at a Brookings Institution event.

This is while Congress and the White House work on housing-finance reform, with the Obama administration still trying to shut down Fannie and Freddie, even though they are the only agencies willing to guarantee 30-year fixed rate mortgages for middle class homeowners and buyers, and thus are the reason housing is recovering at all.

It is the misguided belief that allowing Fannie Mae to disappear—the Federal National Mortgage Association formed during the New Deal—and Freddie Mac, or the Federal Home Loan Mortgage Corporation, formed in the 1970s to further affordable housing—will no longer make the government responsible for keeping a viable housing market for most Americans.

delinguencies

Graph: Calculated Risk

But that is flatly wrong. Without some kind of federal ‘backstop’ that guarantees both mortgage quality and assurance that banks will continue to lend mortgages, we would not have the housing market and a homeownership rate of today. The early 1980s were the best example of banks and lenders refusing or unable to issue new mortgages when then Fed Chairman Volcker raised interest rates above 16 percent to combat inflation.

The foreclosure rate for conforming loans has always been the lowest of any conventional loans. Fannie Mae reported recently that the Single-Family Serious Delinquency rate declined in March to 2.19 percent from 2.27 percent in February. The serious delinquency rate is down from 3.02 percent in March 2013, and this is the lowest level since November 2008.
And Freddie Mac also reported that the Single-Family serious delinquency rate declined in March to 2.20 percent from 2.29 percent in February. Freddie’s rate is down from 3.03 percent in March 2013, and is at the lowest level since February 2009. Freddie’s serious delinquency rate peaked in February 2010 at 4.20 percent.

So their foreclosure rates are close to the historical average of 1 percent, whereas other ‘private label’ mortgages (those mostly portfolio loan issued and held by banks) have remained above 4 percent.

The FHFA is looking at making sure that the companies operate safely in the current environment, Watt said. Watt, who has been noticeably absent until now from the debate over how to reform the U.S. housing market, said Tuesday that the FHFA has three goals: maintain, reduce and build.

“Since any stumbles along the way could have ripple effects in the $10 trillion housing finance market, there’s a lot at stake in getting this right,” Watt said. But getting it right doesn’t mean the federal government shouldn’t have the responsibility to maintain the viability of homeownership, a responsibility it has kept since the 1930s.

Harlan Green © 2014

Follow Harlan Green on Twitter: https://twitter.com/HarlanGreen
Posted in Consumers, Housing, housing market, Politics, Weekly Financial News | Tagged , , , , , , , | Leave a comment