Mortgage Delinquencies Down, Equity Higher

Financial FAQs

According to the second quarter Zillow Negative Equity Report, the national negative equity rate continued to fall in the second quarter, dropping to 23.8 percent of all homeowners with a mortgage from 25.4 percent in the first quarter of 2013. The negative equity rate has been continually falling for the past five quarters.

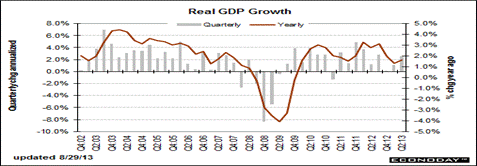
More good news was that real GDP growth for the second quarter was raised to an annualized rate of 2.5 percent compared to the initial estimate of 1.7 percent and compared to a fourth quarter rise of 1.1 percent. Expectations were for 2.2 percent.
clip_image002

Graph: Econoday

Final sales of domestic product showed a revised gain of 1.9 percent versus the advance estimate of 1.3 percent. This series increased 0.2 percent in the first quarter. Final sales to domestic producers (which exclude net exports) was nudged down to 1.9 percent versus the initial estimate of 2.0 percent. This followed a 0.5 percent gain in the first quarter.

In the second quarter of 2013, more than 805,000 American homeowners were freed from negative equity. However, more than 12 million homeowners with a mortgage remain underwater. Moreover, the effective negative equity rate nationally — where the loan-to-value ratio is more than 80 percent, making it difficult for a homeowner to afford the down payment on another home — is 41.9 percent of homeowners with a mortgage.

While not all of these homeowners are underwater, they have relatively little equity in their homes, and therefore selling and buying a new home while covering all of the associated costs (real estate agent fees, closing costs and a new down payment) would be difficult. Of all homeowners – roughly one-third of homeowners do not have a mortgage and own their homes free and clear – 16.7 percent are underwater.
clip_image004

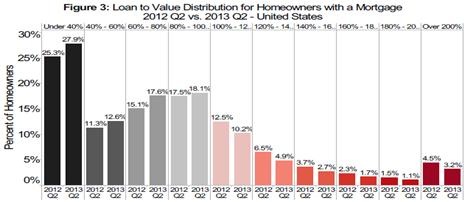
Graph: Zillow

Figure 3 shows the loan-to-value (LTV) distribution for homeowners with a mortgage from 2012 Q2 to 2013 Q2. Even though many homeowners are still underwater and haven’t crossed the 100 percent LTV threshold to enter into positive equity, they are moving in the right direction. The good news is that with these high rates of appreciation negative equity has been reduced at a fast pace in the near-term (this will change as home value appreciation moderates later on this year and into the next, as the current rates are not sustainable).

Over the last year Phoenix’s negative equity rate dropped by 20.4 percentage points, Las Vegas’ dropped by 20.1 percentage points and Sacramento’s dropped by 17.7 percentage points (Q2 2012-Q2 2013). However, nationally the effective negative equity rate remains very high at 41.9 percent. In a move-up market, homeowners with less than 20 percent equity will effectively still be “locked” into negative equity. On average, a U.S. homeowner in negative equity owes $74,700 more than what their house is worth, or 42.3 percent more than the home’s value. While roughly a quarter of homeowners with a mortgage are underwater, 92 percent of these homeowners are current on their mortgages and continue to make payments.

Almost half of the borrowers with negative equity have a LTV of 100 percent to 120 percent (the light red columns). Most of these borrowers are current on their mortgages – and they have probably either refinanced with HARP or the loans are well seasoned (most of these properties were purchased in the 2004 through 2006 period, so borrowers have been current for eight years or so). In a few years, these borrowers will have positive equity.

The key concern is all those borrowers with LTVs above 140 percent (about 8.7 percent of properties with a mortgage according to Zillow). It will take many years to return to positive equity … and a large percentage of these properties will eventually be distressed sales (short sales or foreclosures).

Harlan Green © 2013

Follow Harlan Green on Twitter: www.twitter.com/HarlanGreen
Posted in Consumers, Economy, Housing, housing market, Weekly Financial News | Tagged , , , , | Leave a comment

Labor’s Day Remembered

Popular Economics Weekly

As we celebrate another Labor Day, a national holiday, how do we remember it? I would like to remember it as some other developed countries celebrate it. France, for instance, has enshrined the one-hour lunch, whereas a 2012 survey of North American workers by Right Management found that only one in five reported taking a real break for lunch. Thirty-nine percent even reported they take lunch at their desks in the survey cited by columnist Robyn Blumner in the Tampa Bay Times.

The French don’t have to worry, for they work less and actually produce more per worker. A new survey touted by The Business Insider from UBS has shown that the French continue to work the least amount of hours per year in the world. Once again, the French have blown away the competition. Nationmaster ranks France as #18 in terms of GDP per capita, at $36,500 per person, yet France works much less than most developed nations.

France, for instance, with $36,500 GDP/Capita and works 1,453 hours per year, said the UBS study. This equates to a GDP/Capita/Hour of $25.10. Americans, on the other hand, have $44,150 GDP/Capita but work 1,792 hours per year. Thus Americans only achieve $24.60 of GDP/Capita/Hour.

And a recent visit to Amsterdam in The Netherlands, floored me. Stores can only stay open from 10-5pm, except for Thursday when they are allowed to be open to 9pm, and this in one of the commercial capitals of Europe!

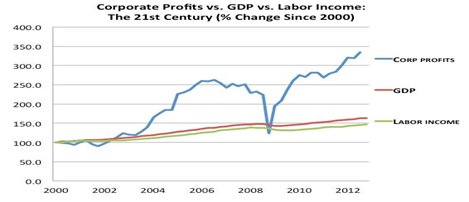
Many economists and policy experts blame the loss of workers’ income on globalization, the exporting of jobs overseas to cheaper climes. But there is a much simpler explanation for the loss of workers’ incomes—record corporate profits that have enabled corporations to suppress their workers’ incomes, mostly via legislative and judicial means

As a percentage of national income, corporate profits stood at 14.2 percent in the third quarter of 2012, the largest share at any time since 1950, while the portion of income that went to employees was 61.7 percent, near its lowest point since 1966, according to the New York Times. In recent years, the shift has accelerated during the slow recovery that followed the financial crisis and ensuing recession of 2008 and 2009.

image

Graph: EPI

The legislative means are clear. Some 24 right-leaning Republican state legislatures have enacted right-to-work laws that actually prevent unions from either organizing, or requiring them to pay union dues, even though they receive all the benefits of unionization. This is not to mention the outright voter suppression tactics of ALEC, the American Legislative Exchange Council, a lobbying organization that has written many of those state laws

Judicially, we know that the Supreme Court’s decision in Citizens vs. United allowed corporations to contribute unlimited amounts to elections, and with their record profits they have not hesitated to back those right-to-work laws.

So who is the richest country in terms of human capital? Perhaps, France that has the best health care and pension systems in the world, or The Netherlands with 10 to 5 working hours, or the country that diverts most of its profits to corporations, their CEOs and investors?

Harlan Green © 2013

Follow Harlan Green on Twitter: www.twitter.com/HarlanGreen
Posted in Consumers, Economy, Politics, Weekly Financial News | Tagged , , , , , , , | Leave a comment

Martin Luther King Worried About Economic Injustice

Popular Economics Weekly

Martin Luther King said the basis of disparities between the races had as much to do with income inequality as outright racism in his book, Why We Can’t Wait.  “Many white Americans of good will have never connected bigotry with economic exploitation. They have deplored prejudice but tolerated or ignored economic injustice.” 

In other words, discrimination has as much to do with socio-economic status as the color of one’s skin today.  This is the 50th anniversary of his “I have a dream” speech, and income inequality is the highest for Americans since 1929, not just for African-American and other minorities. In fact, most economists now agree such record income inequality has been the root cause of both the Great Recession, and Great Depression.

Nobelist Joseph Stiglitz highlighted why the fight for equality was so important:  “Listening to Dr. King speak evoked many emotions for me,” said Dr. Stiglitz. “Young and sheltered though I was, I was part of a generation that saw the inequities that had been inherited from the past, and was committed to correcting these wrongs. Born during World War II, I came of age as quiet but unmistakable changes were washing over American society.”

As of 2010, white families, on average, earned about $2 for every $1 that black and Hispanic families earned, said the Urban Institute in a recent report, a ratio that has remained roughly constant for the last 30 years.

And when it comes to wealth — as measured by assets, like cash savings, homes and retirement accounts, minus debts, like mortgages and credit card balances —non-Hispanic white families, on average, were about four times as wealthy as nonwhite families, according to the Urban Institute’s analysis of Federal Reserve data.

Why has this happened? The Great Recession is the easy answer because it hit blue collar and union workers hardest, but economic policies since the 1970s have tilted incomes away from wage earners towards corporate profits.

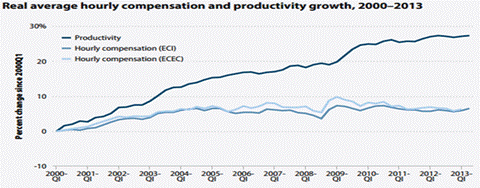
Economic Policy Institute economist and vice-presidential advisor Jared Bernstein highlighted this in a recent study. “The arithmetic of national income accounting is such that when average compensation lags behind productivity growth, as has been the norm in recent years, income is redistributed from paychecks to profits. That’s a characteristic of growing inequality and flows quite simply from the observation that the economy’s growth has to be going somewhere.”

And where have corporate profits gone during that time? That’s a topic for another column, but according to the Federal Reserve, as of the third quarter of 2012 nonfinancial corporations in the United States held $1.7 trillion of liquid assets – cash and securities that could easily be converted to cash.

clip_image002

Graph: EPI

His and many other such graphs highlight how much of the productivity gains in the past decade have been lost to workers with hourly compensation. The EPI report he cites by Lawrence Mishel and Heidi Shierholz said, “Between 2002 and 2012, wages were stagnant or declined for the entire bottom 70 percent of the wage distribution. In other words, the vast majority of wage earners have already experienced a lost decade, one where real wages were either flat or in decline.

Nobelist Paul Krugman also remarked on King’s economic injustice.  “Yet if King could see America now, I believe that he would be disappointed, and feel that his work was nowhere near done. He dreamed of a nation in which his children “will not be judged by the color of their skin but by the content of their character.” But what we actually became is a nation that judges people not by the color of their skin — or at least not as much as in the past — but by the size of their paychecks.”

In fact, we have become a nation divided by income and wealth opportunities, even more than ethnicity or race. In fact, if current rates of national population change trend as they have for the past 20 years, by 2035, (non-Hispanic) whites will be outnumbered by minorities, say demographers. In fact, Hawaii, California, New Mexico, and Texas already have minority non-Hispanic white populations. And that can only mean those minorities will be in a position to fight for a larger share of the wealth, such as higher minimum wage, in spite of the vested interests that oppose it.

What is true economic justice and a living wage should be the question for US. The answer should be as obvious.  It is the wage that enables a family to support itself and give their children the chance to succeed.

Harlan Green © 2013

Follow Harlan Green on Twitter: www.twitter.com/HarlanGreen

Posted in Economy, Keynesian economics, Macro Economics, Politics, Weekly Financial News | Tagged , , , , , | Leave a comment

Case-Shiller Home Prices, Consumer Confidence Continue Rise

The Mortgage Corner

Housing prices continue to climb, but not as fast in the hardest hit areas of Las Vegas and some Florida cities. This is probably because mortgage rates have already risen 1 percent. But rates are no longer rising, as the bond market seems to have already digested the possibility of Fed QE3 ending.

The price appreciation is very strong but has slowed from early in the year. Case-Shiller’s 20-city adjusted index is up 0.9 percent in the June report vs an average monthly gain of 1.4 percent from January to May. But the year-on-year adjusted gain, at a very sizable 12.0 percent, is just off its best level of the recovery which is May at plus 12.2 percent.

clip_image002

Graph: Econoday

Monthly declines have been popping up in the data for the first time this year but are still isolated and mostly marginal. The West had the highest gains, around the 20 percent area led by Las Vegas at 24.8 percent and San Francisco at 24.4 percent. Note that West coast cities posted some of the sharpest declines during the 2008 meltdown. Cities showing the least gains this year are New York, at a year-on-year plus 3.2 percent, and Cleveland at 3.4 percent.

“Overall, the report shows that housing prices are rising but the pace may be slowing. Thirteen out of twenty cities saw their returns weaken from May to June. As we are in the middle of a seasonal buying period, we should expect to see the most gains. With interest rates rising to almost 4.6 percent, home buyers may be discouraged and sharp increases may be dampened,” said David M. Blitzer, Index Committee Chair at S&P Dow Jones Indices.

Meanwhile, the Conference Board’s consumer confidence index improved, but mainly in future wage growth, believe it or not. The report’s composite headline index showed a slight increase, to 81.5 this month from July’s revised 81.0.

But consumers’ expectation took a big jump in income, believe it or not. The expectations component rose to 88.7 for a 2.7 point gain. And it was mostly their outlook on income which, after sliding at the beginning of the year in reaction to the hike in payroll taxes, is now at a 2-1/2 year high. The consumer’s outlook on business conditions and the jobs market are also up.

clip_image004

Graph: Econoday

This is huge, needless to say, as consumers have been spending less because of the higher payroll tax rate until now. In fact, if interest rates do hold at, say, 4.50 percent with zero origination points in California, at least, then housing prices should continue to climb this year with such higher confidence.

Harlan Green © 2013

Follow Harlan Green on Twitter: www.twitter.com/HarlanGreen

Posted in Consumers, Economy, Housing, housing market, Weekly Financial News | Tagged , , , , , | Leave a comment

What’s The Fed To Do?

Popular Economics Weekly

Why the debate over who should be the next Federal Reserve Chairman? There is a tug of war going on between inflation ‘doves’ and ‘hawks’ within the Fed. The debate is whether inflation is or will be a problem because of the $3 trillion plus in money the Fed has injected into the economy, which means will QE3 end sooner or later and in turn when interest rates should be allowed to rise.

And that debate really has little to do with who will succeed Fed Chairman Bernanke next year. Both Vice-Chairman Janet Yellen and Harvard economist Larry Summers are basically doves who advocate the Fed’s purchase of securities to support low interest rates until the economy recovers.

Though Larry Summers sojourn as President of Harvard was a disaster with his seeming lack of administrative abilities, and derogatory remarks against women faculty members. Whereas Dr. Yellen has been groomed to become the first female Federal Reserve Chairperson with her many years serving on the Fed’s Board of Governors.

In fact, even the debate between budget doves and hawks is artificial. The problem is that interest rates (and budget deficits) are driven by many factors, including the cost of money. And the demand (and cost) of money only goes up (while budget deficits decline) when there is a growing economy. This is not the case today, when first quarter GDP grew just 1 percent, while Q2 GDP was barely higher at a 1.7 percent growth rate. This is uncomfortably close to recession levels, even though Bernanke’s Fed has continued to buy $85 billion per month in securities.

image

Graph: Econoday

So there is little demand for money’s use at present, as mirrored by consumer loans, for instance. Even with record low interest rates, helped by the Fed’s bond purchases, consumers can only borrow so much when their incomes haven’t even risen as fast as inflation since 2000.

Chairman Bernanke explained it best in his latest congressional Q&A, as we said last week. “There’s a distinction between prices being high and prices rising…(cost of living) isn’t going up, it’s high, it’s not going up. In other words, real wages are going down because even though inflation is very low wages have been growing slower than inflation.

image

Graph: Econoday

So what is the Federal Reserve to do with household incomes still on the decline, and no inflation? Keeping interest rates as low as possible serves two purposes. It makes credit cheaper and keeps prices lower for consumers. It also makes investing in new plants and equipment cheaper, which encourages more investment in plant expansion and hiring.

Unfortunately, the other branches of government are locked in paralysis, with Republicans only interested in programs that reduce household income, rather than increasing it, by blocking employees’ collective bargaining in Republican-held states and food stamps for needy families. This has a direct effect on consumers’ real disposable incomes, which in turn reduces the very demand for goods and services that would encourage economic growth.

So the fears of asset bubbles and runaway inflation are really distractions at the present. Small government conservatives use the fear of inflation as a camouflage from their real agenda of smaller government. Conservative economists don’t like debt, period, in the belief government borrowing will crowd out private debt. But that can only happen with fuller employment and booming growth.

So the real debate is how much power should the Federal Reserve wield, if any. And that is not a debate we should be having at present. With no one else providing aid to this recovering economy, the Fed is all we have at present to prevent inflation declining further, and another recession.

Harlan Green © 2013

Follow Harlan Green on Twitter: www.twitter.com/HarlanGreen

Posted in Consumers, Economy, Macro Economics, Politics, Weekly Financial News | Tagged , , , , , , , , , , , | Leave a comment

Our Poor Inflation Record

Popular Economics Weekly

Inflation has fallen so low that it threatens this economic recovery. Why? Producers can’t charge more for their products, therefore can’t increase profits unless they use fewer workers and greater automation to replace them.  So there is no incentive to hire more workers, which would increase the demand for their products, and so increase economic growth.

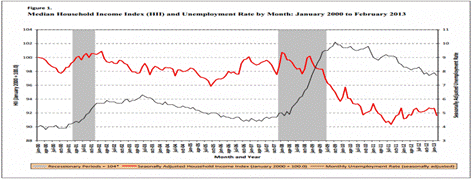
The median household income declined some 10 percent from 2000, after inflation because of less need for highly skilled workers.  And the unemployment rate is still above 7 percent, some 4 years after the end of the Great Recession.

clip_image001

Chart: Trading Economics

That’s because with automation and the Global Information Age, things can be produced more cheaply anywhere in the world where things are cheapest to produce, which puts pressure on workers’ incomes everywhere.  So we know there can’t be as much inflation with unemployment remaining so high. 

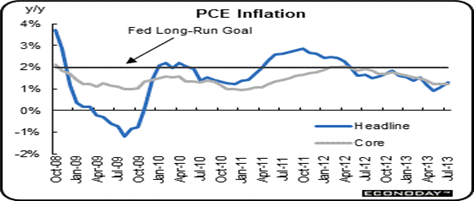
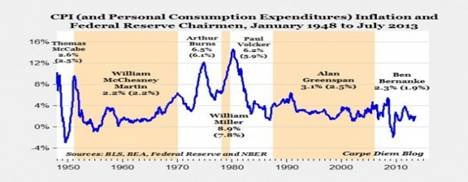
In fact, it is remarkable how closely disinflation (falling inflation) has tracked historical unemployment rates in these charts that begin in 1948, the beginning of the modern consumer economy.  For instance, inflation began its steep decline after 1980 when Fed Chairman Volcker pushed interest rates as high as 16 percent, causing the 1981 and 1983 recessions, and a jobless rate of more than 10 percent. The result of the Great Recession has been the same—high joblessness with too low inflation.

clip_image002

Chart:  Financial Times

            So Fed Chairman Bernanke basically inherited an almost deflationary economic environment in 2006, with the Great Recession that began December 2007 and ended June 2009.  That is why the Fed has been keeping interest rates so low, and why the Fed Governors aren’t yet ready to end the QE3 purchase of securities.  Without QE3, we could be in deep trouble with real estate still in the doldrums.

clip_image003

Chart: Calculated Risk

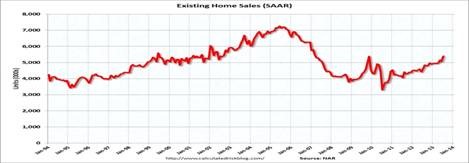
            The good news is that July existing-home sales rose to the highest level in 4 years, since the end of the Great Recession.  The consensus is that most of these homes were put into contract before the recent rise in interest rates, and that the current rise in mortgage rates since then will slow down sales.

            Total existing-home sales, which are completed transactions that include single-family homes, townhomes, condominiums and co-ops, increased 6.5 percent to a seasonally adjusted annual rate of 5.39 million in July from a downwardly revised 5.06 million in June, and are 17.2 percent above the 4.60 million-unit pace in July 2012, said the National Association of Realtors. 

But with just a 5.1-month supply, inventory levels are historically low during this sales season.  That means values haven’t raised enough to allow more homes with positive equity on the market that would create a sustained recovery.  With such a low inventory level there is no danger of either a new housing bubble (meaning too many homes for sale), or inflationary pressures.

Harlan Green © 2013

Follow Harlan Green on Twitter: www.twitter.com/HarlanGreen
Posted in Consumers, Economy, Macro Economics, Weekly Financial News | Tagged , , , , , | Leave a comment

Housing Starts, Builder Confidence Improve

Popular Economics Weekly

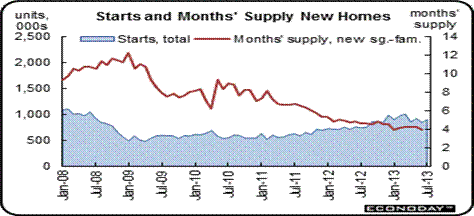
Housing made somewhat of a comeback in July and taking into account wet weather on the East coast should be taken as stronger than face value.  Housing starts in July rebounded 5.9 percent after falling 7.9 percent in June, according to the National Association of Home Builders.  The July starts annualized level of 0.896 million units was up 20.9 percent on a year-ago basis.

And builder confidence in the market for newly built, single-family homes rose three points to 59 on the National Association of Home Builders/Wells Fargo Housing Market Index (HMI) for August, released today. This fourth consecutive monthly gain brings the index to its highest level in nearly eight years.

clip_image002

Graph: Econoday

“Builders are seeing more motivated buyers walk through their doors than they have in quite some time,” said NAHB Chairman Rick Judson. “What’s more, firming home prices and thinning inventories of homes for sale are contributing to an increased sense of urgency among those who are in the market.”

“Builder confidence continues to strengthen along with rising demand for a limited supply of new and existing homes in most local markets,” noted NAHB Chief Economist David Crowe. “However, this positive momentum is being slowed by the ongoing headwinds of tight credit and low supplies of finished lots and labor.”

Nationwide housing starts rose 5.9 percent to a seasonally adjusted annual rate of 896,000 units in July as multifamily construction rebounded from a dip in the previous month, according to newly released figures from HUD and the U.S. Census Bureau. Meanwhile, single-family construction recorded a modest decline from a rate that was upwardly revised for the previous month.

“Builders are making every effort to keep up with the rising demand for new homes and apartments, and construction in both sectors is running well ahead of the pace we saw at this time last year,” noted Rick Judson. “However, ongoing issues with accessing credit and limited supplies of finished lots and labor are making it tough to do that, particularly for single-family builders.”

“Today’s report is in line with our forecast for continued, gradual strengthening of housing starts and permit activity through the rest of the year,” said NAHB Chief Economist David Crowe. “The double-digit bounce-back on the multifamily side was in keeping with typical month-to-month volatility in that sector,” he noted, “while the sideways movement in single-family was a result of unusually wet weather in the South and West.”

Regionally, combined housing starts activity posted solid gains of 40.2 percent in the Northeast, 25.4 percent in the Midwest and 7.2 percent in the West, respectively, in July, while the South posted a 7 percent decline.

Issuance of building permits, which can be an indicator of future building activity, rose 2.7 percent to a seasonally adjusted annual rate of 943,000 units in July. Single-family permits dipped 1.9 percent to 613,000 units from a strong pace in the previous month, while multifamily permits gained 12.6 percent to 330,000 units.

Interest rates will help determine if home construction continues to improve, however. They are up more than 1 percent, with 30-year fixed rate mortgage rates now 4.25 percent with a 1 point origination fee, and 30-year fixed High Balance conforming rates at 4.375 percent for 1 point.

Harlan Green © 2013

Follow Harlan Green on Twitter: www.twitter.com/HarlanGreen

Posted in Consumers, Economy, Housing, housing market, Weekly Financial News | Tagged , , , , | Leave a comment

How To Lower That Household Debt?

Financial FAQs

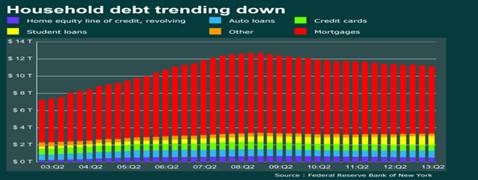
Here is the underlying reason our economy isn’t growing faster, hence creating more jobs. Household debt hasn’t even declined to early 2000 levels, mainly because household incomes haven’t risen above 2000 levels, after inflation is factored in.

Mortgage debt in particular still totals some $8 trillion, for example, whereas it was some $5 trillion in 2003 before housing prices really took off. Then how can households adequately service that debt, and increase their overall spending? They can’t, and so there is very little increase in the demand for goods and services, hence little increase in growth and jobs.

clip_image002

Graph: WSJ Marketwatch/Federal Reserve NY

Household debt is declining, but ever so slowly. In Q2 2013 total household indebtedness fell to $11.15 trillion; 0.7 percent lower than the previous quarter and 12 percent below the peak of $12.68 trillion in Q3 2008, said the New York Federal Reserve in its latest Household Debt and Credit Report.  Mortgages, the largest component of household debt, fell $91 billion from the first quarter.

“Although overall debt declined in the second quarter, households did increase non-housing debt, led by rising auto loan balances,” said Andrew Haughwout, vice president and research economist at the New York Fed.  “Furthermore, households improved their overall delinquency rates for the seventh straight quarter, an encouraging sign going forward.”

This graph from Ezra Klein’s WaPo blog illustrates how much household incomes have fallen, as well. Back in 2007, for instance, median household income was $55,438. That’s declined to $51,404 in February 2013. Those numbers are pretax and adjusted for inflation and seasonal factors. The red line is median household income and blue line the unemployment rate, which is still 7.4 percent.

clip_image004

Graph: Ezra Klein

We can also understand why lowering the budget deficit has been such a problem. It’s not only because government unemployment benefits increase during recessions and their aftermath, but government tax revenues decline precipitously. Even there the effects of reduced household income is obvious. Private sector businesses don’t see increasing demand, so it’s hoarding some $2 trillion plus in cash from record profits, but isn’t hiring many new workers. Meanwhile, banks hold $1 trillion plus in excess reserves, rather than increasing lending.

That leaves only one way to increase household incomes; by borrowing from those excess funds held by the private sector to create more public sector jobs, such as in infrastructure repair, better educational programs, and research and development of new products. The consequent increase in tax revenues then pays down that debt, as it did in the 1950s to 1070s after the record 120 percent World War II federal deficit. So we can see that until more jobs are created, household incomes can’t growth; or households even begin to pay down their debts to pre-recession levels.

Harlan Green © 2013

Follow Harlan Green on Twitter: www.twitter.com/HarlanGreen
Posted in Consumers, Economy, Macro Economics, Politics, Weekly Financial News | Tagged , , , , , | Leave a comment

Will Interest Rates Continue to Rise?

The Mortgage Corner

We think not.  Interest rates are rising, mainly due to some Fed Governors saying they may begin to end the QE3 purchase of securities later this year. But that is based on overly optimistic growth projections by mostly deficit hawks who don’t like the Fed to borrow so much money.

Therefore, we also want to know how this affects real estate sales, with rates already up 1 percent since Bernanke sounded off on the possibility of slowing down purchases this year. The effect will not be good, as RE sales are already slowing.

I believe initial ‘tapering’ of securities in QE3 might not even happen this year because of slowing economic growth, and less than full employment.  Both are stuck at the low end of a recovery, with GDP growth less than 2 percent this year to date, and the unemployment rate still above 7 percent, when 5 percent is closer to full employment.

A key indicator of future sales is mortgage volume, and it has been slowing since the rate rise.  Although the 4-week average of the Mortgage Bankers Association purchase index has generally been trending up over the last year, it has been down over the last couple of months.  However, the 4-week average of the purchase index is still up about 7 percent from a year ago, as the graph shows.

clip_image001

Graph: Calculated Risk

But the refinance index is down some 59 percent, and refinance volumes tend to affect future sales.  The last time the index declined this far was in late 2010 and early 2011 when mortgage rates increased sharply, with the Ten Year Treasury rising from 2.5 percent to 3.5 percent, says Calculated Risk.  The Ten Year Treasury yield is up from 1.6 percent to over 2.7 percent today, but with such slow economic growth we don’t anticipate mortgage rates rising much further.

Santa Barbara and South Coast sales are slowing a bit from the spring, per Gary Woods’ monthly MLS report, but are still better than last year. Single Family and PUD sales are up 4 percent in a year, and the median price up 16 percent. 

“There have been a significant number of new home listings coming on the market,” said Gary in his report, “and with the escrows declining slightly the overall inventory has started to climb. With sales starting to cool the median sales price should continue to rise because available properties in the overheated $600,000 to $900,000 have declined while homes on the market priced above $1 million have become more plentiful.”

Nationally, existing-home sales finally reached its more normal 5 million unit annual rate over the past 2 months, and new-home sales are some 500,000 annually, vs. 1.2 million at the height of the housing bubble, as we said last week. So RE sales and prices have room to grow if economic growth does pick up in the fall, as the more optimistic Fed Governors predict. 

clip_image003

Graph: Econoday

However, the best place to look for interest rate trends is not Wall Street speculators betting on what Bernanke’s Fed will do. It is the actual demand for money, and that is still low for all but student and auto loans. Consumer credit reported by the Commerce Dept. has been strong for so-called installment loans, but not revolving credit card debt.

Consumer credit growth was held down in June to $13.8 billion versus May’s revised $17.5 billion. Revolving credit, which had jumped a revised $6.4 billion in May, contracted $2.7 billion. Revolving credit has been up and down for the whole recovery, reflecting consumer caution and tight lending standards. So excluding autos, June was a weak month for retail sales as reflected in the revolving credit component of this report.

So who knows what the future will bring, with all the political uncertainty? That is probably what the Wall Street speculators are counting on—more uncertainty equals more volatility and so greater profits for the day traders.

Harlan Green © 2013

Follow Harlan Green on Twitter: www.twitter.com/HarlanGreen
Posted in Consumers, Economy, Housing, housing market, Politics, Weekly Financial News | Tagged , , , , , | Leave a comment

Economic Growth Still Too Slow

Popular Economics Weekly

Part of the debate over whether the Fed’s QE3 purchases of securities should end is based on economic growth.  I.e., why isn’t U.S. Gross Domestic Product growing faster than the average annual 2.2 percent rate? Actually, Q1 and Q2 2013 growth is even lower—1 and 1.7 percent, consecutively.

Part of the problem is that the unemployment rate is still 7.4 percent, of course, whereas the historical full employment rate is below 5 percent, which means at least another 2 million need to be employed.  Also current consumer spending seems to be maxed out, with household incomes rising less than inflation, as Fed Chairman Bernanke has been pointing out.  And so hopes are pinned on a housing recovery this year, which is still tentative.

For instance, existing-home sales finally reached its more normal 5 million unit annual rate the past 2 months, and new-home sales are some 500,000 annually, vs. 1.2 million at the height of the housing bubble. So the debate ought to be comparing current GDP growth to its full employment potential output.  In fact, the U.S. economy has lost more than $4 trillion in output from the Great Recession.

clip_image001

Graph:  EPI.org

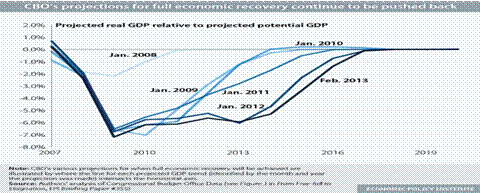
The Congressional Budget Office recently released its updated Budget and Economic Outlook, which highlighted a key theme that recurs in many economic policy discussions: a rapid recovery is projected to begin relatively soon and to reliably deliver the economy back to full health in about four years. The problem is that this full recovery has generally been forecast to be four years away since the Great Recession began five years ago, says the Economic Policy Institute.

The output gap for 2012 was $995 billion, or roughly 5.9 percent of potential output. CBO’s latest economic forecast shows a rapid recovery starting in late 2013 and the full output gap now closing by 2017.   So it seems no one really has an idea when the economy can return to historical growth and employment.  That is a measure of just how ‘great’ was the Great Recession and its aftermath.

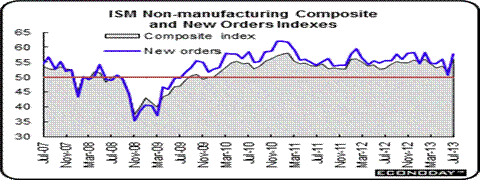
The latest economic data show a possibility of pickup in the fall, which is what the Fed’s deficit hawks are counting on to justify their call for an early end to QE3.  Specifically, both the Institute of Supply Management’s service and manufacturing surveys rose sharply in July.  The ISM’s non-manufacturing report showed the largest surge that drove the composite index up a very substantial 3.8 points to 56.0 for the best reading since February. New orders, the key component in the report, rose nearly 7 points to 57.7 for its best reading since December. And overall business activity really took off, up more than 7-1/2 points to 60.4, also the best reading since December.

clip_image003

Graph: Econoday

            But from what level? It would have to remain above 50, which signals growth, for a considerable period before it is a reliable trend after last month’s dip to no growth in activity. Retail sales also remain healthy.  July’s numbers show an almost 6 percent annual growth rate, close to pre-recession levels.  Within the core, excluding more volatile auto and gasoline sales, gains were widespread with increases in food & beverage stores, health & personal care, clothing, sporting goods & hobbies & music, and general merchandise.  But furniture & furnishings, electronics & appliances, and building materials & garden equipment purchases.

So bottom line seems to be that economic conditions are still very uncertain; especially with the debt ceiling debate about to be repeated in the fall and many of the sequester spending cuts yet to take effect.  There should be no rush to end the Fed’s low interest rate program with such high unemployment levels and congressional gridlock that could even contribute to a further downgrade of federal debt.

Harlan Green © 2013

Follow Harlan Green on Twitter: www.twitter.com/HarlanGreen
Posted in Consumers, Economy, Housing, housing market, Macro Economics, Politics, Weekly Financial News | Tagged , , , , | Leave a comment