Pending Home Sales, Prices Continue to Rise

The Mortgage Corner

Those who doubt the real estate recovery aren’t paying attention to the latest sales’ data. We reported last week the Pending Home Sales Index, a forward-looking indicator based on contract signings, rose 0.3 percent to 106.0 in April from 105.7 in March, and is 10.3 percent above April 2012 according to the National Association of Realtors. The data reflect contracts but not closings.

The doubters are mainly those who believe the Federal Reserve is artificially stimulating home sales by keeping interest rates so low, such as Barron’s conservative economist Gene Epstein. “Why barely one cheer, then (for the housing recovery)? Because this housing recovery has been so stuffed with government steroids, you wonder if it could make it on its own if these drugs were withdrawn.”

But lower interest rates are necessary when consumers buying power has shrunk so badly due to the Great Recession. That is to say, such low interest rates make housing more affordable for the majority of home buyers. Rates will rise of their own accord when incomes (and so inflation) begins to rise, and business activity heats up. Interest rates are really controlled by the demand for money, which increases when spending increases.

Home contract activity is at the highest level since the index hit 110.9 in April 2010, immediately before the deadline for the home buyer tax credit.  Pending sales have been above year-ago levels for the past 24 months.

clip_image002

Graph: Econoday

Lawrence Yun, NAR chief economist, said a familiar pattern has developed.  “The housing market continues to squeak out gains from already very positive conditions.  Pending contracts so far this year easily correspond to higher closed home sales in 2013,” he said.  Total existing-home sales are expected to rise just over 7 percent to about 5 million this year.

This is huge, and though inventories are rising, it’s not enough to keep prices from continuing to rise. “Because of inventory shortages, higher home sales will push up home values to the highest level in five years,” Yun said.  The national median existing-home price should increase close to 8 percent and exceed $190,000 in 2013.

And the S&P Case-Shiller Home Price Index reports the year-on-year increase of 10.9 percent is the first double-digit gain since May 2006.

clip_image004

Graph: Econoday

The bottom line is activity in the housing sector is heating up with April existing-home sales rising 0.6 percent to an annual rate of 4.97 million. Supply, which had been very tight, poured into the market during April with 230,000 units added to lift the months supply to 5.2 from 4.7 months. The median time for a house on the market fell dramatically, to 46 days vs 62 days in March.

And sellers are getting their price based on the report’s price data. After jumping 6.2 percent in March, the median price rose another 4.8 percent in April to $192,800 which is the highest level of the recovery. We should note that price data in this report, which are not based on repeat transactions, are often volatile. But who can argue with a double digit year-on-year median gain at 11.0 percent?

Harlan Green © 2013

Follow Harlan Green on Twitter: www.twitter.com/HarlanGreen

Posted in Consumers, Economy, Housing, housing market, Politics, Weekly Financial News | Tagged , , , , , | Leave a comment

What Will the Federal Reserve Do??

Popular Economics Weekly

Now the fat’s in the fire. Both stocks and bond prices have been falling of late, due to the fear that the Fed will end its $85 billion per month QE purchases of Treasury and mortgage securities too soon. Fed Chairman Bernanke had said that if employment continued to improve, the Fed might begin to “taper” its purchases as soon as its June FOMC meeting.

And today the Bureau of Labor Statistics reported the May unemployment report rose from 7.5 to 7.6 percent because 420,000 more people are looking for work, though 175,000 more payroll jobs were created in May! So what’s the Fed to do? On the face of it, the Fed can’t begin to end QE purchases because its stated goal of 6.5 percent unemployment isn’t close to being reached.

image

Graph: Calculated Risk

And both inflation indexes and consumer incomes show there is still insufficient demand for more goods and services that would cause the U.S. economy to grow closer to its normal longer term GDP growth rate of 3.5 percent. It grew just 2.2 percent last year, and predictions for 2013 are not much better.

This graph of personal consumption expenditure prices illustrates the problem. Prices have been falling, and when prices fall, so do profits. Hence wages and so employment remains stagnant, stuck where it has essentially been over the past 3 years. Then why are we worried?

image

Inflation hasn’t been running at the 2 to 2.5 percent average that prevailed before the Great Recession, in other words. Hence those calling for an early exit from QE are doing the country a disservice. It means fewer new jobs and therefore more remaining unemployed. The Bureau of Labor Statistics said some 13.6 million are “marginally attached” to the labor force and still looking for full time work. The unemployment rate for them is an even larger 13.8 percent — down from 13.9 percent in April — if everyone who wants a full-time job but can’t find one is included. Millions of Americans still cannot find work nearly four years after the recession ended.

So who is calling for an early end to QE? No less than Former Fed Chairman Alan Greenspan, for one. “Bond prices have got to fall. Long-term rates have got to rise. The problem, which is going to confront us, is we haven’t a clue as to how rapidly that’s going to happen. And we must be prepared for a much more rapid rise than is now contemplated in the general economic outlook.”

But interest rates generally rise and fall in tandem with inflation, and inflation is still falling. That means getting closer to full employment, which is when inflation historically becomes a problem. So we have a long way to go before worrying about interest rates rising too fast.

Harlan Green © 2013

Follow Harlan Green on Twitter: www.twitter.com/HarlanGreen

Posted in Consumers, Economy, Keynesian economics, Politics, Weekly Financial News | Tagged , , , , , , , , , , | Leave a comment

Housing Prices Rise as Foreclosure Rates Fall

The Mortgage Corner

Home prices are continuing to rise, in part because foreclosure rates continue to fall. Fannie Mae reported that the Single-Family Serious Delinquency rate declined in April to 2.93 percent from 3.02 percent in March. The serious delinquency rate, covering loans 90 days or more delinquent or in foreclosure, is the lowest level since January 2009.The Fannie Mae serious delinquency rate peaked in February 2010 at 5.59 percent.

Foreclosed homes tend to sell for 33 percent less than normal market prices, which depresses housing values. So the drop in foreclosures means fewer homes are sold at under market prices.

Freddie Mac reported that the Single-Family serious delinquency rate declined in April to 2.91 percent from 3.03 percent in March. Freddie’s rate is down from 3.51 percent in April 2012, and this is the lowest level since June 2009. Freddie’s serious delinquency rate peaked in February 2010 at 4.20 percent.

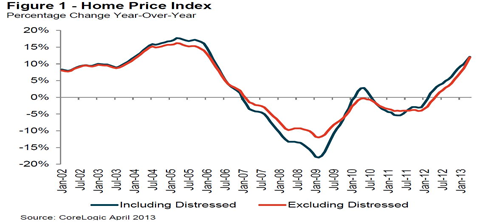
This is while CoreLogic reported home prices nationwide, including distressed sales, increased 12.1 percent on a year-over-year basis in April 2013 compared to April 2012. This change represents the biggest year-over-year increase since February 2006 and the 14th consecutive monthly increase in home prices nationally. On a month-over-month basis, including distressed sales, home prices increased by 3.2 percent in April 2013 compared to March 2013.

image

Graph: Calculated Risk

Excluding distressed sales, home prices increased on a year-over-year basis by 11.9 percent in April 2013 compared to April 2012, but longer-term housing prices will rise faster when excluding distressed sales, says CoreLogic. This is because CoreLogic’s distressed sales include short sales and real estate owned (REO) transactions, which could boost overall prices over the short term due to the high demand by investors who are buying up many in bulk.

More evidence that the lack of homes on the market has been driving up prices is pending home sales, or homes under contract but not yet closed, which rose only 0.3 percent in April, following a 1.5 percent boost the month before.

image

Graph: Econoday

The National Association of Realtors Pending Home Sales Index reports home contract activity was at the highest level since the index hit 110.9 in April 2010, immediately before the deadline for the home buyer tax credit.  Pending sales have been above year-ago levels for the past 24 months.

And Econoday reports “a regional look shows the effect of tight inventory which is most severe in the West and where pending home sales fell 7.6 percent. Price data from the West, in reports such as Case-Shiller, have been showing the very sharpest gains. Home-price appreciation is a very big story right now in the economy and this report points to continued upward pressure.”

The bottom line is activity in the housing sector is heating up with April existing-home sales rising 0.6 percent to an annual rate of 4.97 million, according to the National Association of Realtors. Sales of single-family homes, the most important component in the report, rose 1.2 percent in the month

Supply, which had been very tight, poured into the market during April with 230,000 units added to lift the months supply to 5.2 from 4.7 months. The median time for a house on the market fell dramatically, to 46 days vs 62 days in March.

And sellers are getting their price based on the report’s price data. After jumping 6.2 percent in March, the median price rose another 4.8 percent in April to $192,800 which is the highest level of the recovery. We should note that price data in this report, which are not based on repeat transactions, are often volatile. But who can argue with a double digit year-on-year median gain of 11.0 percent?

Harlan Green © 2013

Follow Harlan Green on Twitter: www.twitter.com/HarlanGreen
Posted in Uncategorized | Tagged , , , , , , , , | Leave a comment

Social Security Isn’t Dead

Popular Economics Weekly

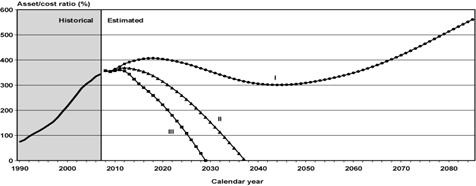
Social Security isn’t dead, or even dying, in spite of the prediction by the Social Security Trustees that it will no longer be able to pay full benefits by 2033. That’s because the Trustees use what are called ‘intermediate’ assumptions of income and tax growth that have prevailed since the huge shift in wealth upward beginning in the 1970s, depressing incomes of the middle and lower income earning brackets.

clip_image002

The Trustees base their projection on growth rates of population, wages and employment that comprise the Gross Domestic Product, and not wanting to be overly optimistic, pick what they believe to be a medium GDP growth rate over the next 75 years in the mid-2 percent range, rather than the longer term historical rate of 3.5 percent over the past 75 years.

There are reasons for optimism, in other words, if employment and wage growth can be brought back to historical levels, instead of assuming more recent growth rates that are result of 5 recessions since 1980, which in turn were the result of experiments with so-called supply-side economics that emphasized lower tax rates for investors and and reduced government spending. This ‘experiment’ resulted in tremendous economic upheavals and $trillions in productive output lost.

clip_image004

Graph: US Social Security Admin

The Social Security Trustees own Alternative I, the “lower cost” estimate, would in fact never run out of funds. Hence the need to focus on what creates economic growth. It’s really a no-brainer.  More growth requires more jobs that pay a living wage for starters, which means more collective bargaining power and the strengthening of labor laws that have been weakened over the past 30 years.

There has been very little research, other than historical, on the ingredients of robust growth. But history does show that the continued transfer of wealth away from the consuming public to the wealthiest, while keeping corporate and high income tax rates as low as possible, hurts overall economic growth.

How? By the outright suppression of collective bargaining of wage and salary earners, either via such corporation backed groups as ALEC, the American Legislative Exchange Council, or Republican majorities in the right to work states that inhibit union organizing efforts, for starters. And those Republican majorities are due in part to blatant voter suppression laws in those states, again supported by the likes of ALEC.

Economists such as Thomas Piketty and Emmanuel Saez have shown that this has been going on for decades—since the 1970s, really, when high income tax brackets began to be lowered under the rationale that it would boost economic growth. But alas, the opposite has happened.

We need another New Deal to bring back the middle and lower class earning potential, real jobs paying wages real wages, in other words. Then we won’t have to worry about social security, worry less about Medicare, and stop the impoverishment of the majority of Americans who actually produce the wealth that should guarantee them a comfortable retirement.

Harlan Green © 2013

Follow Harlan Green on Twitter: www.twitter.com/HarlanGreen

Posted in Consumers, Economy, Macro Economics, Politics, Weekly Financial News | Tagged , , , , , , | 1 Comment

A Greater Recession, if Fed QE Ends Too Soon

Financial FAQs

The stock and bond markets are sinking because of Fed Chairman Bernanke’s seemingly offhand remark that the Fed could slow down its QE purchases of securities as early as its June FOMC meeting. Now Organization for Economic Development and Cooperation (OECD) economists are saying that could hurt worldwide growth! Of course it will, since the U.S. is leading the worldwide recovery from the Great Recession, while our own economy is only beginning to recover. And we know from past history it takes many years to recover from such a severe downturn.

Why? The huge transfer of wealth upward has to be reversed, as it was after the Great Depression when income inequality was as bad as it is today. And that takes time. It took 10 years plus a World War in the case of the Great Depression, after Roosevelt tried to prematurely balance the federal budget in 1937, plunging the U.S. economy back into depression, hence making it the Great Depression.

There is a danger this could be repeated. Already the second Q1 2013 estimate of Growth Domestic Product growth revised growth downward to 2.4 percent from its 2.5 percent initial estimate. Even though consumer spending was revised up to 3.4 percent from 3.2 percent, it didn’t offset the reduction in government spending. The 2.4 percent rate is certainly ok, but it’s not enough to lower the unemployment rate that is currently 7.5 percent with 18 million workers still looking for full time work.

This is because consumers aren’t earning enough money to boost the demand for what is being produced. This is something that so-called Austerians, those who don’t like debt of any kind, can’t seem to understand. Because they believe that high debt is always the problem. Even during a time when borrowing isn’t the problem. That is to say, during a time when not enough is being purchased in the private sector to stimulate higher growth.

And we know why incomes have been stagnant or falling for most consumers. The collective bargaining of most employees has been severely weakened, or even banned in the case of public workers in states like Wisconsin. Pro-labor laws have been rolled back over the past 30 years that has resulted in record corporate profits and record income inequality not seen since the 1929 Black Market crash.

This is while tax rates for the wealthiest have been slashed, creating more income flowing away from most consumers. A recent National Bureau of Economic Research paper in fact shows that the more top tax rates are cut, the greater the share of national income is diverted to the wealthiest citizens.

image

Graph: Krugman NYTimesBlog

Nobelist Paul Krugman said it best in disputing the Austerians. Inflation is almost nonexistent, having dropped to 1 percent in the GDP revision. Why is low inflation a problem, he asks? “One answer is that it discourages borrowing and spending and encourages sitting on cash. Since our biggest economic problem is an overall lack of demand, falling inflation makes that problem worse. Low inflation also makes it harder to pay down debt, worsening the private-sector debt troubles that are a main reason overall demand is too low.”

This is at the heart of the Austerians misconception. Money is hoarded rather than spent when demand is low and inflation falling. And households won’t spend more if they are intent on paying down debts.

The banks are holding some $1 trillion in excess reserves, while corporations are sitting on almost $5 trillion in cash, according to the Federal Reserve Bank of St. Louis. So why is inflation falling? Krugman says “The answer is the economy’s persistent weakness, which keeps workers from bargaining for higher wages and forces many businesses to cut prices. And if you think about it for a minute, you realize that this is a vicious circle, in which a weak economy leads to too-low inflation, which perpetuates the economy’s weakness.”

And that is our current problem that could lead us back into a Greater Recession. Government spending has been cut back due to the Sequester agreement, while taxes have been raised on must of US. There is really only one solution to weak demand.  Less money has to flow to the top income earners, whether through rising taxes on maximum income tax brackets, or closing corporate tax loopholes, or a combination of both.

Otherwise, we once again will be doomed to repeat a historic mistake—not putting our wealth where it will do the most good, whether that is repairing our obsolete infrastructure, in education, protecting the environment, or even saving social security .

Harlan Green © 2013

Follow Harlan Green on Twitter: www.twitter.com/HarlanGreen

Posted in Consumers, Economy, Macro Economics, Politics, Weekly Financial News | Tagged , , , , , , , , , , , | Leave a comment

Housing Prices at Seven-Year High

The Mortgage Corner

The S&P Case-Shiller Home Price Index just reported home prices were accelerating strongly going into  a very strong April start to the Spring housing season. The Case-Shiller 20-city data show a very strong 1.1 percent monthly adjusted increase in March home prices for a fourth straight gain over 1.0 percent which is the strongest run since the boom days of 2005. The year-on-year increase of 10.9 percent is the first double-digit gain since May 2006.

image

Graph: Econoday

The prices in last week’s new and existing home sales show recovery-best gains and even record gains, as we said last week, tied to lack of homes on the market. Price data for these reports are not based on repeat transactions, unlike Case-Shiller data that confirm strong gains going into April.

One reason for the strong showing in housing is consumer confidence is returning to pre-recession levels. It works both ways. Rising home prices and a rising stock market are two key factors that are boosting consumer confidence, which further boosts confidence. A third factor is rising strength in the jobs market.

image

Graph: Econoday

The Conference Board reported its consumer confidence index jumped 7.2 points in May to a recovery best level of 76.2. Adding to the general showing of strength is a 9 tenths upward revision to April to 69.0. The assessment of the present situation is at a recovery best of 66.7, up nearly 6 points from April in a reading that hints at broad strength for May’s run of economic data. This run includes jobs as more say jobs are plentiful, 10.8 percent vs April’s 9.7 percent, and fewer say jobs are hard to get, at 36.1 percent for an 8 tenth improvement from April’s 36.9 percent.

Says Lynn Franco, Director of Economic Indicators at The Conference Board: “Consumer Confidence posted another gain this month and is now at a five-year high (Feb. 2008, Index 76.4). Consumers’ assessment of current business and labor-market conditions was more positive and they were considerably more upbeat about future economic and job prospects. Back-to-back monthly gains suggest that consumer confidence is on the mend and may be regaining the traction it lost due to the fiscal cliff, payroll-tax hike, and sequester.”

Consumers’ outlook for the labor market was also more upbeat, said the Conference Board report. Those expecting more jobs in the months ahead improved to 16.8 percent from 14.3 percent, while those expecting fewer jobs decreased to 19.7 percent from 21.8 percent. The proportion of consumers expecting their incomes to increase dipped slightly to 16.6 percent from 16.8 percent, while those expecting a decrease edged down to 15.3 percent from 15.9 percent.

Meanwhile, we also reported last week that according to the First Look report for April by Lender Processing Services (LPS), the percent of loans delinquent decreased in April compared to March, and declined about 10 percent year-over-year, reports Calculated Risk. Also the percent of loans in the foreclosure process declined further in April and were down almost 25 percent over the last year.

All these factors point to a much stronger housing market this year. After all, housing prices are still some 28 percent below their housing bubble high in 2006, according to Case-Shiller.

Harlan Green © 2013

Follow Harlan Green on Twitter: www.twitter.com/HarlanGreen
Posted in Consumers, Economy, Housing, housing market, Weekly Financial News | Tagged , , , , , | Leave a comment

Ben Bernanke and the Fragile Recovery

Financial FAQs

We know how fragile is the U.S. economic recovery just from the past 48 hours, because both U.S. and Japanese stock prices plummeted, and interest rates jumped on a seemingly offhand remark made by Fed Chairman Bernanke in congressional testimony that a reduction in the Fed’s QE bond purchases could begin as early as June.

Bernanke has said earlier in his testimony that “A premature tightening of monetary policy could lead interest rates to rise temporarily but would also carry a substantial risk of slowing or ending the economic recovery and causing inflation to fall further.”

It’s just that such a seemingly offhand shouldn’t upset markets both here and in Japan, if there was confidence that stronger recoveries were in hand. Instead, it seems there is little confidence that the U.S. in particular will maintain its stimulus programs for a long enough period—at least until the unemployment rate drops to the Fed’s stated goal of 6.5 percent from its current 7.5 percent. That would bring the U.S. closer to full employment, though still a long way from the 5 percent rate that is considered to be full employment by most economists.

And prematurely ending government stimulus of any kind after what Paul Krugman calls the Lesser Depression (rather than Great Recession) is a lesson we have learned in the past, then seemingly unlearned when so-called ‘Austerians’, small government conservatives who believe cutting government spending is the way to cure a recession, grab the spotlight.

The ‘greatest’ lesson was learned in 1937, when Roosevelt listened to a newly elected Republican Congress that demanded a balanced budget and end to government spending. The result was the U.S. economy plunged back into what became the Great Depression that lasted until World War II defense spending ended it.

It has also been unlearned in Europe, where today small government Austerians are in control, having slashed government spending, causing unemployment to soar and plunging the euro zone back into recession.

So the danger is that history might repeat itself in the good old U.S. of A., if the minority of Federal Reserve Governors mentioned in the latest release of Federal Open Market Committee minutes get their way that favor an earlier demise of QE purchases.

clip_image002

Graph: Trading Economics

Why is the U.S. recovery still so fragile? It’s not only because 18 million workers either have no job or work part time. It is because prices are not rising. And when companies can’t raise their prices, they don’t hire more employees. That is to say, our inflation rate is too low and continuing to fall.

The danger of falling prices is the other lesson ‘unlearned’ that has been experienced by Japan over the past 2 decades. Japan has been in a deflationary spiral where wages as well as prices have been falling, the result of prematurely ending its own stimulus programs. The result is the Japanese standard of living has fallen as its economy has been shrinking.

clip_image004

Graph: Trading Economics

Only now under new Prime Minister Shinzō Abe is Japan practicing Quantitative Easing, or the purchasing of its own securities by its Central Bank. Paul Krugman says those in Europe and the U.S. who continually call for less government intervention during weak recoveries believe in what he calls the “confidence fairies”, magical beings who instill confidence in future economic growth only when government budgets are balanced and inflation is low.

But that means they have unlearned the lessons of our past. For such ideal conditions only happen after an economy has recovered and government has the means to pay down its debt, which means fully employing its citizens.

Harlan Green © 2013

Follow Harlan Green on Twitter: www.twitter.com/HarlanGreen

Posted in Consumers, Economy, Macro Economics, Politics, Weekly Financial News | Tagged , , , , , , , , , , , , , , | Leave a comment

Existing-Home Sales, Inventories Climbing

The Mortgage Corner

Total existing-home sales, which are completed transactions that include single-family homes, townhomes, condominiums and co-ops, increased 0.6 percent to a seasonally adjusted annual rate of 4.97 million in April, reports the National Association of Realtors. This could be a trend, as housing inventories are also increasing, while foreclosure rates continue to fall, allowing more homes on the market. Sales activity is 9.7 percent above the 4.53 million-unit level in April 2012.

clip_image002

Graph: Calculated Risk

Total housing inventory at the end of April rose 11.9 percent, a seasonal increase to 2.16 million existing homes available for sale, a 5.2-month supply at the current sales pace, compared with 4.7 months in March. Listed inventory is 13.6 percent below a year ago, when there was a 6.6-month supply, with current availability tighter in the lower price ranges. Inventories are improving, but more homes need to be available for sale to continue the upward trend.

Lawrence Yun, NAR chief economist, said the market is solidly recovering.  “The robust housing market recovery is occurring in spite of tight access to credit and limited inventory.  Without these frictions, existing-home sales easily would be well above the 5-million unit pace,” he said.  “Buyer traffic is 31 percent stronger than a year ago, but sales are running only about 10 percent higher.  It’s become quite clear that the only way to tame price growth to a manageable, healthy pace is higher levels of new home construction.”

Meanwhile, according to the First Look report for April by Lender Processing Services (LPS), the percent of loans delinquent decreased in April compared to March, and declined about 10 percent year-over-year, reports Calculated Risk. Also the percent of loans in the foreclosure process declined further in April and were down almost 25 percent over the last year.

LPS reported the U.S. mortgage delinquency rate (loans 30 or more days past due, but not in foreclosure) decreased to 6.21 percent from 6.59 percent in March. Note: the normal rate for delinquencies is around 4.5 to 5 percent. The percent of loans in the actual foreclosure process declined to 3.1 percent in April from 3.37 percent in March, but that is still higher than pre-recession levels.

One danger signal to a continued housing recovery are rising mortgage rates, however. They have been rising from as low as 3.25% for the conforming 30-year fixed rate to 3.625 percent today.  And this has caused mortgage applications to drop. The Refinance Index decreased 12 percent from the previous week. The seasonally adjusted Purchase Index decreased 3 percent from one week earlier.

“Mortgage rates increased to their highest level since March last week, leading to the largest single week drop in refinance applications this year,” said Mike Fratantoni, MBA’s Vice President of Research and Economics. “The refinance index has fallen almost 19 percent over the past two weeks and is back to its lowest level since late March. Purchase activity declined over the week but is still running about 10 percent above last year’s pace at this time.”

Given consumers’ slow growing incomes, such low interest rates have been the main driver of housing sales. We can only hope the Federal Reserve continues its Quantitative Easing purchases of securities to keep interest rates low enough for housing to fully recover.

Harlan Green © 2013

Follow Harlan Green on Twitter: www.twitter.com/HarlanGreen

Posted in Consumers, Economy, Housing, housing market, Weekly Financial News | Tagged , , , , , , , , , , | 1 Comment

Consumer Sentiment, Leading Indicators Signal Higher Growth

Popular Economics Weekly

Both the University of Michigan’s Consumer Sentiment survey and Conference Board’s Index of Leading Indicators rose in May, signaling that employment and growth may be stronger than forecast by most economists.

How can that be with 7.5 percent of the workforce looking for work and some 18 million that have either part time, or no work at all? The real answer is the U.S. economy is almost too complex to accurately measure, and economists have their biases when predicting growth. In fact, few understand what is called macroeconomics, which helps to predict how government polices affect growth.

For instance, Haver Analytics surveys monthly a group of leading economists, and found that the latest Blue Chip survey foresaw U.S. economic growth of 1.6 percent in Q1’13 following an anemic 1.4 percent rise during Q4’12, when Q1 GDP growth was actually 2.5 percent.

“There is, however, divergence as to the degree of further improvement,” wrote Haver Analytics in a major understatement. “By the end of 2013, the consensus foresees GDP growing at 2.7 percent rate with the top 10 forecasts at 3.6 percent and the bottom 10 at 1.8 percent. The same divergence holds true for next year’s expected growth. The consensus of a 3.0 percent advance in real GDP for Q4 2014 is derived from 3.8 percent at the top end and 2.2 percent at the bottom.”

The Blue Chip Indicators also forecast a 7.5 percent unemployment rate by the end of 2013, when it has already dropped to that level in May. The Congressional Budget Office also forecasts 2 percent growth this year, rising to 3.5 percent in 2014.

clip_image002

Graph: Calculated Risk

Consumer spirits are improving dramatically this month in what very well may be a reflection of improvement in the jobs market. The consumer sentiment index jumped to 83.7 for the mid-month reading vs 76.4 for the final April reading and vs April’s mid-month reading of 72.3. The Econoday consensus was looking for 78.0 with the high-end estimate at 82.5. The latest reading is near the recovery high set in November.

Boosted by strength in housing permits, the Conference Board’s index of leading economic indicators (LEI) surged 0.6 percent in April, double the rate of growth expected by the Econoday consensus and at the high-end of the Econoday consensus. The gain points to rising economic momentum six months out.

Also showing strength are financial measures, including credit activity, as well as jobless claims and the stock market. On the negative side are manufacturing measures, which reflect this sector’s ongoing bumpy ride, as well as consumer expectations. This latter factor, however, is very likely to turn positive in May judging by this morning’s big jump in the consumer sentiment report.

clip_image004

Graph: Haver Analytics

The bottom line is that conditions may be improving enough that consumers are willing to spend again. The household debt-service ratio – an estimate of the share of debt payments to disposable personal income – fell to 10.38 percent in Q4’12, reported the Federal Reserve.

That was the lowest since the series started in 1980. In comparison, the ratio, which takes into account outstanding mortgage and consumer debt, was 10.56 percent in the third quarter. It peaked in the third quarter of 2007, shortly before the U.S. economy fell into recession. This may give consumers, who power 70 percent of economic activity, enough confidence to spend again.

Harlan Green © 2013

Follow Harlan Green on Twitter: www.twitter.com/HarlanGreen

Posted in Consumers, Economy, Macro Economics, Weekly Financial News | Tagged , , , , , , , , | Leave a comment

S. California RE Sales Return to 2006 Levels

The Mortgage Corner

DataQuick just reported Southern California homes sold at the fastest pace for an April in seven years amid the release of pent-up demand for move-up homes and high levels of investor purchases. This is while April new-home construction dipped slightly, though housing permits for new construction are increasing at 1 million units, annually.

The median sale price rose to a 58-month high, reflecting both home price appreciation as well as the simultaneous plunge in foreclosure resales and surge in mid- to up-market buying. On average, sales between March and April have risen 1.0 percent since 1988, when DataQuick’s statistics begin.

The median price paid for all new and resale houses and condos sold in the six-county Southland was $357,000 last month, up 3.3 percent from $345,500 in March and up 23.1 percent from $290,000 in April 2012. Last month’s median was the highest since June 2008, when the median was $360,000.

Last month’s sales were the highest for the month of April since 27,114 Southland homes sold in April 2006, but they were 11.8 percent below the April average of 24,291 sales. The low for April sales was 15,303 in 1995, while the high was 37,905 in April 2004.

“This is a market that is still re-balancing. Sales of deeply discounted properties in affordable neighborhoods are way down. Activity in middle and high-end communities is on its way up. Now it’s catch-up time, with a healthier economy spurring more demand and rising prices tempting more people to put their homes up for sale,” said John Walsh, DataQuick president.

clip_image002

Graph: Econoday

Privately-owned housing starts in April were at a seasonally adjusted annual rate of 853,000. This is 16.5 percent below the revised March estimate of 1,021,000, but is 13.1 percent above the April 2012 rate of 754,000. Single-family housing starts in April were at a rate of 610,000; this is 2.1 percent below the revised March figure of 623,000. The April rate for units in buildings with five units or more was 234,000.

But Privately-owned housing units authorized by building permits in April were at a seasonally adjusted annual rate of 1,017,000. This is 14.3 percent above the revised March rate of 890,000 and is 35.8 percent above the April 2012 estimate of 749,000. So we can see that future construction looks promising and continues the building surge in 2013.

So it is no surprise that builder confidence in the market for newly built, single-family homes improved three points to a 44 reading on the National Association of Home Builders/Wells Fargo Housing Market Index (HMI) for May. This gain, from a downwardly revised 41 in April, reflected improvement in all three index components – current sales conditions, sales expectations and traffic of prospective buyers.

Harlan Green © 2013

Follow Harlan Green on Twitter: www.twitter.com/HarlanGreen

Posted in Consumers, Economy, Housing, housing market, Weekly Financial News | Tagged , , , , , | Leave a comment