Consumers Key to Future Growth

Popular Economics Weekly

The February unemployment report gives a big boost to predictions for 2013 growth. The unemployment rate fell to 7.7 percent, and some 236,000 nonfarm payroll jobs were added to the workforce (246,000 private payroll jobs, less 10,000 government jobs lost). The next piece of the puzzle will be consumer spending. Will the increase in jobs be enough to offset the payroll tax increase? February retail sales, which account for one-third of consumer spending, comes out on Wednesday.
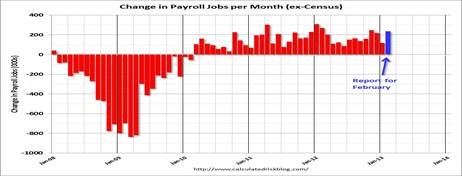
clip_image002

Graph: Calculated Risk

What makes the February report more hopeful was also the increase in incomes. Earnings have been oscillating monthly, but average hourly earnings increased 0.2 percent in February, following a gain of 0.1 percent January.   And the average workweek edged up to 34.5 hours in February from 34.4 hours the month before.

Turning to detail for the Household Survey that includes the self-employed, the decrease in the unemployment rate was from a 130,000 drop in the labor force, a 170,000 rise in household employment, and a 300,000 decrease in unemployed, a sign that more have stopped looking for work.

clip_image004

Graph: Econoday

Why are consumers the key to growth? Because they have been contributing to most of the Gross Domestic Product growth of late—1.5 percent in Fourth Quarter’s meager overall 0.1 percent rise in GDP activity, while government spending and inventories have been contracting.

clip_image006

Graph: Econoday

January’s retail sales fell slightly due to the tax increase but have still been averaging 4.8 percent since 2010, which matched the overall increase in jobs since then. Gains were scattered, led by general merchandise (up 1.1 percent), nonstore retailers (up 0.9 percent), and building materials & garden supplies (up 0.3 percent).  Weakness was in miscellaneous store retailers (down 2.6 percent), health & personal care (down 1.0 percent), and clothing & accessories (down 0.3 percent).

clip_image008

Graph: Econoday

The Conference Board’s January Index of Leading Economic Indicators also helps a bit when reading 2013 tea leaves. Interest rate and credit components were strong pluses for the outlook as is the rally in the stock market. Two very important components also on the plus side were lower unemployment claims and higher building permits. The claims point to strength in the jobs market and the permits to strength in housing. A negative is consumer expectations which could be low for a number of reasons–higher payroll taxes, uncertainty over future income, and higher gasoline prices, say analysts.

But we know consumer expectations are notoriously fickle, and can change direction suddenly. The latest Conference Board survey of consumer confidence shows a slight improvement, but it remains at the low end.

Why should consumers be more confident with so many still out of work and the White House fighting with Congress over budget deficits, rather than proposing more job creation programs? It should be clear by now that too much government austerity is the danger, as in Europe, while the private sector is using most of its profits in other ways—whether to create more jobs overseas, or for mergers and acquisitions, or more speculation on Wall Street.

Harlan Green © 2013

Follow Harlan Green on Twitter: www.twitter.com/HarlanGreen

Posted in Consumers, Economy, Politics, Weekly Financial News | Tagged , , , , , , , | Leave a comment

Expanding Service Sector Will Boost Growth

Financial FAQs

Why are stock indexes breaking records? Part of it is because of record corporate profits (which affects price-to-earnings ratios), up 20 annually since the end of 2008, as well as good job news that is boosting investor optimism. The bulk of the nation’s economy is growing strongly and looks to continue to grow strongly in 2013. The ISM’s non-manufacturing (service sector) index rose nearly one point to a higher-than-expected level of 56.0. It means 56 percent of respondents reported a stronger pace of overall growth relative to what was already a strong rate in January.

clip_image002

Graph: Econoday

New orders are up a very sharp 3.8 points to 58.2 with backlogs posting a 5.5 point jump to a very strong 55.0. New orders coming in and old orders piling up is a good mix for the employment outlook. And non-manufacturers are already hiring, at 57.2 which may be down three tenths from January but is still an exceptionally strong rate of monthly employment growth.

Add to that the Labor Department’s 236,000 increase in payrolls and drop to 7.7 percent unemployment rate, and we see a more certain business environment, now that most of the budget battles have been resolved. It didn’t seem to matter who won, in other words. And 179,000 of the added jobs were in the service sector, vs. 67,000 in the goods-producing sector, which highlights why the service sector is the main engine of growth.

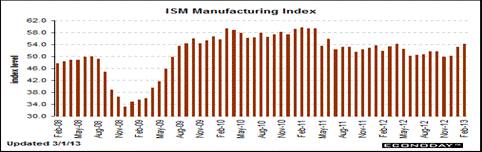
The ISM’s manufacturing report also had very good news with accelerating monthly growth for general activity, reflected in a 1.1 point gain for the headline index to 54.2, and acceleration in new orders which jumped 4.5 points to a very strong 57.8. A plus in this report is strength in new orders for exports are also accelerating, to 53.5 for a 3-1/2 point gain. Total backlogs are especially strong in the ISM report, at 55.0 for a big 7-1/2 point gain, which means exports will be picking up again.

clip_image004

Graph: Econoday

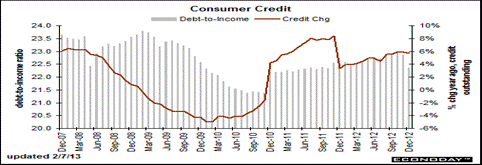
The only question mark is the consumer sector, which powers 70 percent of activity. The consumer continues to take on new debt at a steady and strong clip but whether it points to rising consumer demand is uncertain. Consumer credit rose $14.6 billion in December vs. a revised $15.9 billion in November, and $14.0 billion in October. But the revolving, credit-card side hasn’t been adding to the total. Revolving credit has been very flat, up a little bit one month and then down a little bit the next and is down $3.6 billion in the latest data. This could limit spending.

clip_image006

The service sector and manufacturing indexes are the best measure of overall economic activity, and so point to much better growth in 2013.

Harlan Green © 2013

Follow Harlan Green on Twitter: www.twitter.com/HarlanGreen
Posted in Consumers, Economy, Macro Economics, Weekly Financial News | Tagged , , , , , , | Leave a comment

January Housing Prices, Mortgages, Surging

The Mortgage Corner

CoreLogic reported that home prices nationwide, including distressed sales, increased on a year-over-year basis by 9.7 percent in January 2013 compared to January 2012. This change represents the biggest increase since April 2006 and the 11th consecutive monthly increase in home prices nationally.

Excluding distressed sales, home prices increased on a year-over-year basis by 9.0 percent in January 2013 compared to January 2012. On a month-over-month basis excluding distressed sales, home prices increased 1.8 percent in January 2013 compared to December 2012. The five states with the highest home price appreciation, including distressed sales, were: Arizona (+ 20.1 percent), Nevada (+17.4 percent), Idaho (+14.9 percent), California (+14.1 percent) and Hawaii (+14.0 percent).

clip_image002

Graph: Calculated Risk

This is a huge increase, and may mean borrowers and home buyers fear interest rates may rise later this year, as some Federal Reserve Governors are objecting to the sustained purchase of QE3 securities until the unemployment rate drops to 6.5 percent from its current 7.8 percent.

A major reason for the price increases is increased mortgage activity due to still low interest rates, even though stocks are rallying to record highs. The Mortgage Bankers Association reported both the Refinance and Purchase Indexes increased 15 percent from the previous week and were at the highest levels since mid-January to early February.

clip_image004

Graph: Calculated Risk

The 30-year fixed conforming rate is still at 3.50 percent for a 0 point origination fee in California, and the high-balance fixed rate is now 3.75 percent also for 0 points origination.

Another reason for such rising prices is the decline in mortgage delinquency and foreclosure rates. These are homes that tend to sell under market prices, which bring down overall values. The delinquency rate for mortgage loans on one-to-four-unit residential properties fell to a seasonally adjusted rate of 7.09 percent of all loans outstanding at the end of the fourth quarter of 2012, the lowest level since 2008, according to the Mortgage Bankers Association’s (MBA) National Delinquency Survey.

The delinquency rate includes loans that are at least one payment past due but does not include loans in the process of foreclosure. The percentage of loans in the foreclosure process at the end of the fourth quarter was 3.74 percent, the lowest level since the fourth quarter of 2008, down 33 basis points from the third quarter and 64 basis points lower than one year ago.

And lastly, an increase in overall wealth has to be putting consumers in a buying mood. CNBC estimates that $1 trillion of the $4.8 Trillion increase in household wealth since the end of the Great Recession has been from rising housing values, and studies show homeowners tend to spend 10 percent of that increase, more than the additional wealth created by financial markets.

Harlan Green © 2013

Follow Harlan Green on Twitter: www.twitter.com/HarlanGreen
Posted in Consumers, Economy, Housing, housing market, Weekly Financial News | Tagged , , , , , , , , , , , , , | Leave a comment

Let’s Bring Back American Jobs

Popular Economics Weekly

It’s well-known that American job formation isn’t keeping up with economic growth, but not why. It’s mostly because corporations have been retaining more of their profits and sharing less with their employees, so that household incomes have fallen to historic lows as a share of national income. That has to be reversed, if we are to get back to full employment, and employees are again paid a living wage.

It makes sense economically, since households consume some 70 percent of what is produced, diminished incomes have reduced the public’s demand for the very goods and services that would create more jobs.

So the why is not something we see in everyday headlines. WSJ Marketwatch has said that if 175,000 jobs are added in Friday’s Labor Department unemployment report, then the 135 million jobs total will just bring it back to mid-2008 levels during the Great Recession.

Why have corporations been able to rack up such profits? The conventional wisdom is because of strong global demand, cheap global labor, and low interest rates, while American workers muddle along, their significance to these companies greatly diminished by a worldwide market for goods and people.

But it’s more than that. American workers have not been able to share in that prosperity. Economist John Kenneth Galbraith pointed out as early as the 1960s in The Affluent Society, among other writings, that labor was no longer an equal partner in the Big Business, Government, Labor triumvirate. Thanks to business-friendly legislation—such as the deregulation of whole industries and Wall Street finance, corporations began to grow beyond government’s power to control their behavior.

Most American workers today are paid a barely living wage, as household incomes have declined steadily since the 1970s, while labor productivity has soared. This is while labor friendly laws were weakened that gave corporations more power to hire and fire. And Right to Work laws enabled states to inhibit or even prohibit collective bargaining, which prevented workers from negotiating for their own wages.

clip_image002

U.S. companies today give wage and salary earners the least amount of vacation and, health care coverage, while working the longest hours, of any developed country. The American employee has lost the ability to control their own destiny, in other words.

The New York Times highlighted the divergence of record corporate profits from the meager jobs formation, and income gains. Corporate profits have risen 20 percent annually since the end of 2008, while disposable (after tax) incomes have risen just 1.4 percent. This trend has in fact been happening since the 1970s, but especially since 2000 and the concerted push of Republicans to increase corporate and investment tax breaks, which pushed more of the tax burden on ordinary households.

clip_image004

Graph: The Atlantic

“We went almost a century where the labor share was pretty stable and we shared prosperity,” says Lawrence Katz, a labor economist at Harvard. “What we’re seeing now is very disquieting.” For the great bulk of workers, labor’s shrinking share is even worse than the statistics show, when one considers that a sizable — and growing — chunk of overall wages goes to the top 1 percent: senior corporate executives, Wall Street professionals, Hollywood stars, pop singers and professional athletes.

Corporate power in America is now becoming egregious, as corporations continue to consolidate power over everyday life. Corporate lobbying groups such as ALEC now write states’ legislation that limits voters’ rights and environmental regulation, as well as pushing for even less gun regulations that now endanger children.

ALEC, the American Legislative Exchange Council is the corporate-funded organization that allows global corporations like Wal-Mart and ideological special interests like the National Rifle Association (NRA) to give state legislators changes to the laws they desire. ALEC “model bills” have served as the template for voter ID laws that swept the country in 2011, for the “voucher” programs that privatize education, for anti-environmental deregulatory bills, and for the wave of anti-union legislation in Wisconsin, Ohio, and most recently, Michigan.

So it turns out taking away the voice of American employees is really taking away democracy for the majority of Americans, something that cannot be tolerated if America is to remain a prosperous democracy.

Harlan Green © 2013

Follow Harlan Green on Twitter: www.twitter.com/HarlanGreen

Posted in Consumers, Economy, Keynesian economics, Macro Economics, Politics, Weekly Financial News | Tagged , , , , , , , , | 2 Comments

When Is Federal Debt Not a Burden?

Financial FAQs

The sequester advocates have gotten their way. The March 1 deadline has passed to reach an agreement to alter the across the board spending cuts and so governments will begin the draconian job cuts that will certainly slow economic growth this year—up to 750,000 jobs lost and as much as 0.6 percent off GDP growth if some compromise isn’t reached in coming weeks.

This all came about because of a lack of understanding of basic economic principles, propagated by those who should know better. One such economist and deficit hawk is Dallas Fed President Richard Fisher, who is calling for a gradual reduction in QE3 bond purchases this year, because of the ‘money Ritalin”, or artificial boost it is giving to economic growth.

“I think it’s really time to taper this off,” Fisher said recently on CNBC. “It doesn’t mean stop it. We’re not going from Wild Turkey to cold turkey. But I do think we’ve run up to the limits of the efficacy of what we’re doing. It’s a good time to do it.”

He maintains the economy is improving but job creation isn’t picking up fast enough. Really? That is precisely why QE3 is so important. Fed Chairman Bernanke recently said “We believe the monetary policies that we’ve conducted have helped get a stronger recovery and more jobs than we otherwise would have had,” during his semiannual Congressional testimony.

What is it that Fisher and the deficit hawks don’t understand about Bernanke’s statement? Why doesn’t Fisher believe the facts; that Fed policies have helped a stronger recovery “than we otherwise would have had?”

They confuse overall debt with annual deficits, for one. The annual federal deficit is dropping the fastest in history—and in fact endangering this recovery. While history has shown the only way to reduce overall government debt is by increasing economic growth, which means stimulating job formation and so tax revenues. (Note that economic stimulus shouldn’t be a bad word in the context of creating more jobs, since it generates increased revenues to pay down the debt.)

clip_image002

Graph: Calculated Risk

Cutting taxes, which inordinately benefits the wealthiest 1 percent, hasn’t stimulated much growth—especially during the GW Bush administration which ran up the largest government debt since World War II, accompanying the slowest recovery since then, as well as helping to cause the Great Recession.

The answer to why such misconceptions then should be obvious. The so-called “debt burden” that economists such as Fisher and even Carmen Reinhardt and Kenneth Rogoff have said slow economic growth, is only a burden if programs aren’t in place to stimulate future growth. Cutting government spending for programs that create future jobs (in infrastructure, education, research and development) at a time of weak economic recovery, such as now, only further weakens the recovery.

It’s the chicken and the egg conundrum. Will just increasing the supply of money stimulate growth? Not unless it is spent wisely. Conservatives, such as deficit hawks believe that cutting taxes and so government spending puts more money into private pockets. But not when the private sector hoards the increased profits due to a lack of demand for their products, rather than investing it in future growth.

This is after all the definition of a recession—falling demand that leads to greater joblessness, due to falling prices or some outside event like the 1970’s oil embargos—that deficit hawks in particular don’t want to understand.

It is very basic economics 101. Just cutting spending doesn’t reduce debt without also investing in future growth. The sequester job cuts in particular will just diminish the revenues needed to bring down the federal government’s overall debt load.

Harlan Green © 2013

Follow Harlan Green on Twitter: www.twitter.com/HarlanGreen

Posted in Consumers, Economy, Macro Economics, Politics, Weekly Financial News | Tagged , , , , , , | Leave a comment

Mortgage Delinquencies Lowest Since 2008

The Mortgage Corner

The delinquency rate for mortgage loans on one-to-four-unit residential properties fell to a seasonally adjusted rate of 7.09 percent of all loans outstanding at the end of the fourth quarter of 2012, the lowest level since 2008, according to the Mortgage Bankers Association’s (MBA) National Delinquency Survey.

The delinquency rate includes loans that are at least one payment past due but does not include loans in the process of foreclosure. The percentage of loans in the foreclosure process at the end of the fourth quarter was 3.74 percent, the lowest level since the fourth quarter of 2008, down 33 basis points from the third quarter and 64 basis points lower than one year ago.

“We are seeing large improvements in mortgage performance nationally and in almost every state.  The 30 day delinquency rate decreased 21 basis points to its lowest level since mid-2007. With fewer new delinquencies, the foreclosure start rate and foreclosure inventory rates continue to fall and are at their lowest levels since 2007 and 2008 respectively,”   said Jay Brinkmann, MBA’s Chief Economist and Senior Vice President of Research.

The foreclosure starts rate decreased by the largest amount ever in the MBA survey and now stands at half of its peak in 2009. Similarly, the 33 basis point drop in the foreclosure inventory rate is also the largest in the history of the survey.   

Brinkman said the two biggest factors impacting the number of loans in the foreclosure process still are the magnitude of the problem in Florida and the judicial foreclosure systems in some states.  12 percent of the mortgages in Florida are in the process of foreclosure, down from a peak of 14.5 percent last year but still an extraordinarily high rate that is impacting the national rate.  In addition, while the percentages of loans in foreclosure dropped in almost all states, the average rate for judicial states was 6.2 percent, triple the average rate of 2.1 percent for nonjudicial states.

And RealtyTrac reported foreclosure-related sales accounted for 21 percent of all U.S. residential sales during 2012, down from 23 percent of all sales in 2011 and down from 28 percent of all sales in 2010.

clip_image002

Graph: RealtyTrac

Properties not in foreclosure that sold as short sales in 2012 accounted for an estimated 22 percent of all residential sales — bringing the total share of distressed sales to 43 percent including both foreclosure-related sales and non-foreclosure short sales.

California, Georgia, Nevada posted highest percentage of foreclosure sales in 2012. Foreclosure sales accounted for more than 38 percent of all residential sales in California in 2012, the highest percentage of any state but down from 44 percent of all sales in 2011 and down from 49 percent of all sales in 2010. California pre-foreclosure sales in 2012 increased 12 percent from 2011 while California REO sales decreased 27 percent over the same time period.

Home prices continue to recover, rising gradually. The FHFA price index for December for homes with Fannie Mae and Freddie Mac conventional mortgages gained 0.6 percent, following a rise of 0.4 percent the prior month. The December advance was led by the East South Central region, increasing 2.3 percent, with the Middle Atlantic region down 0.1 percent.

clip_image004

Graph: Econoday

The year-on-year rate posted at plus 5.8 percent versus 5.4 percent in November.
The FHFA report combined this morning with a favorable Case-Shiller report, point to further progress in restoring home prices toward pre-recession levels. Much of the price rise comes from the decline in for sale inventories to a low 4 month supply at current sales rates for both new and existing-home sales.

And as the number of foreclosure and short sale transactions continue to decline, prices could rise even faster, further boosting the real estate recovery.

Harlan Green © 2013

Follow Harlan Green on Twitter: www.twitter.com/HarlanGreen

Posted in Economy, Housing, housing market, Weekly Financial News | Tagged , , , , , , | Leave a comment

Bernanke’s Fed Growing U.S. Economy

Popular Economics Weekly

Right now, the Federal Reserve seems to be the only government agency focused on growing the economy. Washington has otherwise been focused on the sequester agreement, or how to further cut government spending. But such austerity measures don’t grow economies, as the current European experience shows. Europe is in its second year of a repeat recession. Great Britain is in its third recession since its Conservative Party began its own austerity cuts.

That is why Fed Chairman Ben Bernanke’s testimony this week is so important. The Federal Reserve has to continue holding down interest rates for the foreseeable future. He has specifically said that the unemployment rate has to fall to 6.5 percent from its present 7.8 percent before the Fed will begin to raise interest rates.

It won’t be easy, as the so-called deficit hawks on the Fed’s Board of Governors have been sounding off on the dangers of inflation if the Fed keeps buying some $85 Billion per month in bonds and mortgage backed securities that are holding interest rates at historical lows. But there isn’t any inflation. There hasn’t been inflation since the busting of the housing bubble.

“We do not see the potential costs of the increased risk-taking in some financial markets as outweighing the benefits of promoting a stronger economic recovery and more-rapid job creation,” he said in his prepared testimony.

clip_image002

Graph: Econoday

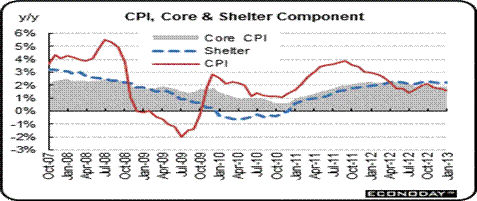
Year-on-year, overall CPI inflation fell to 1.6 percent in January from 1.8 percent in December (seasonally adjusted). The core rate posted at 1.9 percent in January, matching December’s rate.  This isn’t incipient inflation. It’s incipient deflation, which depresses wages as well as prices. Incipient deflation—or disinflation in this case where pricing aren’t rising as fast—companies can’t raise their prices. So they can’t increase profits and hire more employees. It’s the simplest of equations lost on deficit hawks and those advocating an additional $85 Billion cut in sequester spending.

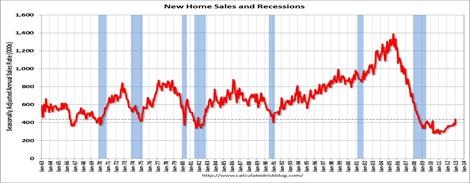
Housing seems to be the one sector outside of manufacturing that the Fed is having the most effect. Especially with new-home construction. New home sales surged in January, rising 16 percent to a 4-1/2-year high of 437,000, with all regions reporting increases. On a year over year basis, January sales are reported to have risen 29 percent, the same as the increase in single-family building permits over that period.

clip_image004

Graph: Calculated Risk

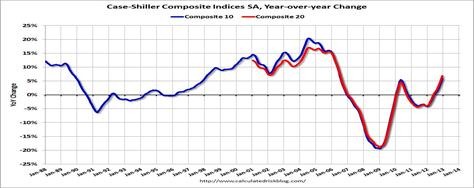
And the Case-Shiller Home Price Index showed prices will continue to rise this year. Data through December 2012 reported that all three headline composites ended the year with strong gains. The national composite posted an increase of 7.3 percent for 2012. The 10- and 20-City Composites reported annual returns of 5.9 percent and 6.8 percent in 2012. In addition to the three composites, nineteen of the 20 MSAs posted positive year-over-year growth – only New York fell.

clip_image006

Graph: Calculated Risk

“Home prices ended 2012 with solid gains, said David M. Blitzer, Chairman of the Index Committee at S&P Dow Jones Indices.

“Housing and residential construction led the economy in the 2012 fourth quarter. In December’s report all three headline composites and 19 of the 20 cities gained over their levels of a year ago. Month-over-month, 9 cities and both Composites posted positive monthly gains. Seasonally adjusted, there were no monthly declines across all 20 cities.”

So we have to thank Ben Bernanke for keeping his word. We also know from both the Japanese and European experience that austerity kills growth rather than boosting it. Europe is back in recession, while Japan just elected a pro-growth administration that wants to spend more to promote growth.

Harlan Green © 2013

Follow Harlan Green on Twitter: www.twitter.com/HarlanGreen

Posted in Consumers, Economy, Housing, housing market, Macro Economics, Politics, Weekly Financial News | Tagged , , , , , , , , , | Leave a comment

The Sequester Dilemma—How Much Is Too Much Austerity?

Financial FAQs

Come March 1, we will begin to see how much damage the sequester agreement causes. A recent CNBC column by Larry Kudlow illustrates both the misconceptions and reason for the gridlock on avoiding across-the-board spending cuts of some $85 Billion to the federal budget..

Kudlow says “Looking at the sequester in this light (only half of sequester cuts take place immediately), it’s clear that it won’t result in economic Armageddon. In fact, I’ll make the case that any spending relief is actually pro-growth. That’s right. When the government spending share of GDP declines, so does the true tax burden on the economy. As a result, more resources are left in the free-market private sector, which will promote real growth.”

In fact, GW Bush’s program of huge tax cuts that lessened the “true tax burden” while continuing government spending proved just the opposite. Pumping all that money into the private sector resulted in the slowest post-WWII growth in history, plus the Great Recession, the worst recession since the Great Depression.

Taxpayers paid for those tax cuts and wars, in other words, pushing corporations to record profits and the top 1 percent of income-earners to 121 percent of all income earned from 2009-2011. This is while incomes of the 99 percent that do most of the spending actually shrank 0.4 percent during that time, per economist Emmanuel Saez. So “real growth” wasn’t promoted, because the 1 percent hoarded their profits and paid themselves higher salaries, rather than reinvesting in the economy.

The Congressional Budget Office predicts that allowing the sequester cuts to kick in on March 1 will ultimately result in 750,000 lost jobs and subtract 0.6 percent from GDP growth. Why? Because when both the private sector and government cuts spending, there is no investment in future growth, period.

clip_image002

Graph: Calculated Risk

It’s actually worse than that, because unused production capacity will remain unused, which is the real casualty of a further cut in government spending. It has already been reduced some $2.35 trillion from existing legislation. Policymakers have enacted nearly $1.5 trillion in spending cuts for appropriated programs (mainly through the annual caps enacted in the 2011 Budget Control Act) and nearly $600 billion in revenue increases in ATRA, the American Tax Relief Act agreement reached in December.

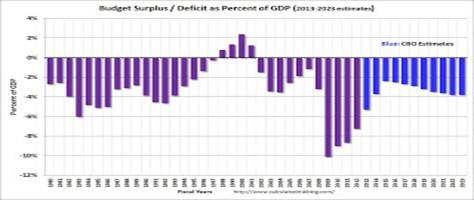
The Congressional Budget Office expects the deficit to shrink from 8.7 percent of GDP in fiscal 2011 to 5.3 percent in fiscal 2013 if the sequester takes effect and to 5.5 percent if it doesn’t. Either way, the two-year deficit reduction — equal to 3.4 percent of the economy if automatic budget cuts are triggered and 3.2 percent if not—would stand far above any other fiscal tightening since World War II, and could lead to another recession. For without rising household incomes, with private sector businesses that aren’t reinvesting, only the government can boost the demand for goods and services.

Harlan Green © 2013

Follow Harlan Green on Twitter: www.twitter.com/HarlanGreen

Posted in Consumers, Economy, Keynesian economics, Macro Economics, Weekly Financial News | Tagged , , , | Leave a comment

Housing Affordability Up, Inventories Still Shrinking

The Mortgage Corner

The National Association of Home Builders (NAHB) reported exceptionally low interest rates helped ensure a slight gain in nationwide housing affordability amid relatively stable house prices in the final quarter of 2012, according to the just released National Association of Home Builders/Wells Fargo Housing Opportunity Index (HOI).

In all, 74.9 percent of homes sold between the beginning of October and end of December were affordable to families earning the U.S. median income of $65,000. This was up nearly a percentage point from the 74.1 percent of homes sold that were affordable to median-income earners in last year’s third quarter.

Interest rates have risen about one-quarter percent from their recent lows, to average 3.50 percent for 30-year fixed rate conforming loan amounts in California with zero points origination fees. Even so-called High-Balance 30-year fixed conforming amounts are averaging 3.75 percent with zero points origination fees, still phenomenally low, thanks to the Federal Reserve’s QE buying programs.

“The most recent housing affordability data should be encouraging to many prospective home buyers, because it shows that homeownership remains within reach of median-income consumers even as most local markets appear to be on a recovery path,” said NAHB Chairman Rick Judson.  He noted that the most recent reading of the NAHB/First American Improving Markets Index found that 259 out of 361 metros currently qualify as improving, including representatives from all 50 states and the District of Columbia.

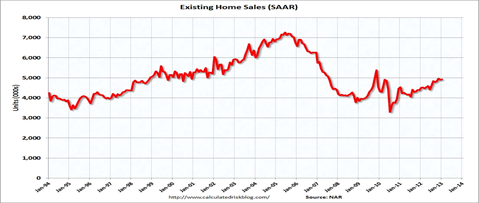
This is while Total existing-home sales, which are completed transactions that include single-family homes, townhomes, condominiums and co-ops, increased to a seasonally adjusted annual rate of 4.92 million in January from a downwardly revised 4.90 million in December, and are 9.1 percent above the 4.51 million-unit pace in January 2012. The graph shows sales’ levels are almost back to 2000 levels, the beginning of the fastest rise in housing prices.

image

Graph: Calculated Risk

NAR chief economist Lawrence Yun said tight inventory is a major factor in the market. “Buyer traffic is continuing to pick up, while seller traffic is holding steady,” he said. “In fact, buyer traffic is 40 percent above a year ago, so there is plenty of demand but insufficient inventory to improve sales more strongly. We’ve transitioned into a seller’s market in much of the country.”

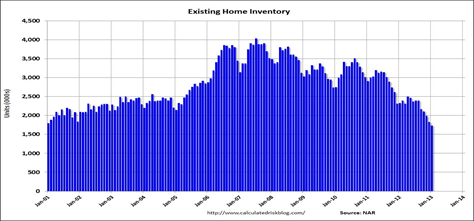
Total housing inventory at the end of January fell 4.9 percent to 1.74 million existing homes available for sale, which represents a 4.2-month supply at the current sales pace, down from 4.5 months in December, and is the lowest housing supply since April 2005 when it was also 4.2 months, but also close to 2000 levels.

image

Graph: Calculated Risk

Listed inventory is 25.3 percent below a year ago when there was a 6.2-month supply. Raw unsold inventory is at the lowest level since December 1999 when there were 1.71 million homes on the market.

“We expect a seasonal rise of inventory this spring, but it may be insufficient to avoid more frequent incidences of multiple bidding and faster-than-normal price growth,” said Yun.

The question yet to be answered is whether the declining prices of foreclosure sales discussed in my last blog will increase the housing supply in months to come.

Harlan Green © 2013

Follow Harlan Green on Twitter: www.twitter.com/HarlanGreen

Posted in Consumers, Economy, Housing, housing market, Weekly Financial News | Tagged , , , , , , | Leave a comment

No Double Dip Recession—Why Worry?

Popular Economics Weekly

Goldman Sachs chief economist Jan Hatzius has joined the chorus that says 2013 should be a good year for growth, in spite of the so-called ‘fiscal headwinds’ of a gridlocked Congress and White House.

Why? Because both domestic and worldwide demand is picking up. U.S. exports have risen some 50 percent just since the end of the recession, while employment was given a boost with the December unemployment report that showed an additional 335,000 jobs were created in 2012 than originally prognosticated.

And real estate in 2013 may finally be rid of the drag from foreclosure sales. Calculated Risk has put up an interesting report by FNC, a real estate research firm, which says foreclosure prices have bottomed out over several months.

image

Graph: FNC

FNC’s report shows that foreclosure price discounts, which compare a foreclosed home’s estimated market value to its final sales price, have dropped to pre-mortgage crisis levels at about 12.2 percent in Q4 2012. At the height of the mortgage crisis in 2008 and 2009, foreclosed homes were typically sold at more than 25 percent below their estimated market value. Additionally, the report indicates that the typical size of foreclosed homes is also approaching pre-crisis levels.

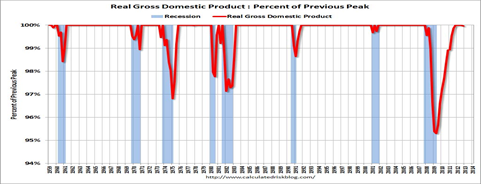
Calculated Risk also reports on the 4 economic indicators used by the National Bureau of Economic Research (NBER) that determine business cycle troughs and peaks. So far just two—real GDP and personal income less transfer payments have reached their pre-recession levels. Industrial production and employment have yet to reach their previous peaks.

This tells us there is still unused potential, among other things. For instance, real GDP returned to the pre-recession peak in Q4 2011, and hit new post-recession highs for four consecutive quarters until dipping slightly in Q4 2012. (Gray areas are recessions.) But Q4 may be revised up from new data on increased exports and higher inventory levels released after the “advance” Q4 estimate. It will be followed by 2 revisions as more complete information is available to the Commerce Department’s Bureau of Economic Research.

image

Graph: Calculated Risk

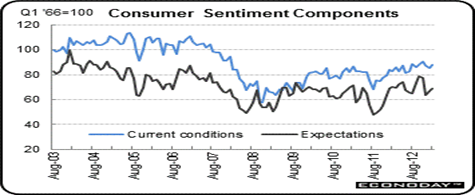
A note about consumer confidence is in order here. Deficit hawks and austerity advocates want to continue to shrink government, their rationale being that businesses will hire more workers and expand if only they had confidence in future growth. But business confidence is really based the whether the demand for their goods and services is increasing or decreasing, not on what governments might or might not do.

image

Graph: Calculated Risk

And said demand depends in part on whether consumers feel better about their finances, among other things. Confidence levels have been rising, as jobs and housing values have increased, but are nowhere near pre-recession levels. Let us see whether personal income, one of the 4 business cycle indicators, continues to improve.

Harlan Green © 2013

Follow Harlan Green on Twitter: www.twitter.com/HarlanGreen

Posted in Consumers, Economy, Housing, housing market, Macro Economics, Politics, Weekly Financial News | Tagged , , , , , , | Leave a comment