Shadow Housing Inventory, Foreclosures Fall

The Mortgage Corner

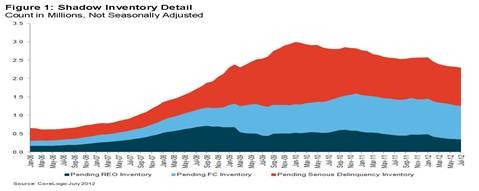
CoreLogic reported the current residential shadow inventory as of July 2012 fell to 2.3 million units, representing a supply of six months. This was a 10.2 percent drop from July 2011, when shadow inventory stood at 2.6 million units, which is approximately the same level the country was experiencing in March 2009. Currently, the flow of new seriously delinquent (90 days or more) loans into the shadow inventory has been roughly offset by the equal volume of distressed (short and real estateclip_image002 owned) sales.

“The decline in shadow inventory has recently moderated reflecting the lower outflow of distressed sales over the past year,” said Mark Fleming, chief economist for CoreLogic. “While a lower outflow of distressed sales helps alleviate downward home price pressure, long foreclosure timelines in some parts of the country causes these pools of shadow inventory to remain in limbo for an extended period of time.”

Data Highlights as of July 2012:

  • As of July 2012, shadow inventory fell to 2.3 million units or six-months’ supply and represented just over three-fourths of the 2.7 million properties currently seriously delinquent, in foreclosure or in REO.
  • Of the 2.3 million properties currently in the shadow inventory, 1 million units are seriously delinquent (2.9 months’ supply), 900,000 are in some stage of foreclosure (2.5-months’ supply) and 345,000 are already in REO (1.0-months’ supply).
  • The dollar volume of shadow inventory was $382 billion as of July 2012, down from $397 billion a year ago and $385 billion last month.
  • Serious delinquencies, which are the main driver of the shadow inventory, declined the most from April 2012 to July 2012 in Arizona (3.2 percent), Pennsylvania (2.8 percent), New Jersey (2.3 percent), Delaware (2.2 percent) and Maine (2.2 percent).
  • As of July 2012, Florida, California, Illinois, New York and New Jersey make up 45 percent of all distressed properties in the country.
clip_image004

Graph: Calculated Risk (1/06-7/12)

CoreLogic also released its latest National Foreclosure Report which provides monthly data on completed foreclosures, foreclosure inventory and 90+ delinquency rates.

  • The five states with the highest number of completed foreclosures for the 12 months ending in August 2012 were: California (110,000), Florida (92,000), Michigan (62,000), Texas (58,000) and Georgia (55,000). These five states account for 48.1 percent of all completed foreclosures nationally.
  • The five states with the lowest number of completed foreclosures for the 12 months ending in August 2012 were: South Dakota (25), District of Columbia (113), Hawaii (435), North Dakota (564) and Maine (612).
  • The five states with the highest foreclosure inventory as a percentage of all mortgaged homes were: Florida (11.0 percent), New Jersey (6.5 percent), New York (5.2 percent), Illinois (4.8 percent) and Nevada (4.6 percent).
  • The five states with the lowest foreclosure inventory as a percentage of all mortgaged homes were: Wyoming (0.5 percent), Alaska (0.8 percent), North Dakota (0.8 percent), Nebraska (0.9 percent) and South Dakota (1.1 percent).
clip_image006

Graph: Calculated Risk

Corelogic said that home prices nationwide, including distressed sales, increased on a year-over-year basis by 4.6 percent in August 2012 compared to August 2011. This change represents the biggest year-over-year increase since July 2006. On a month-over-month basis, including distressed sales, home prices increased by 0.3 percent in August 2012 compared to July 2012.

So we see the Federal Reserve’s commitment to keep interest rates at historic lows for as long as it takes to revive the housing market, and bring down the unemployment rate to more acceptable levels, is already showing results.

Harlan Green © 2012
Posted in Economy, Housing, housing market, Weekly Financial News | Tagged , , , , | Leave a comment

Consumers In Holiday Mood

Popular Economics Weekly

Consumers are going to celebrate the holidays in a much bigger way than in recent years. Not only have consumer confidence and expectations been rising since summer, but consumer borrowing is exploding, signaling that we will see a surge in holiday spending. This is what will ultimately boost both employment and gross domestic product growth, which fell to 1.3 percent in Q2.

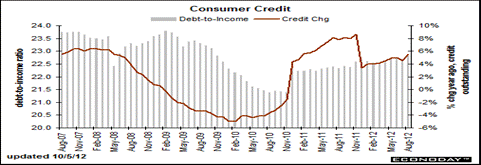
For instance, another big jump in student loans drove consumer credit higher in August, up $18.1 billion split between a $13.9 billion rise for non-revolving credit and a $4.2 billion rise for revolving credit. Non-revolving credit shows across the board gains reflecting that month’s very strong vehicle sales but mostly a surge in the federal government component which is where Sallie Mae student loans are classified. Even the gain in revolving credit is solid and confirms the rise underway in consumer confidence, to fund credit card purchases.

clip_image002

Graph: Econoday

Even better news was that the September unemployment rate fell to 7.8 percent, mainly because 873,000 more found jobs in the Household Survey that includes the self-employed.

clip_image004

Graph: Calculated Risk

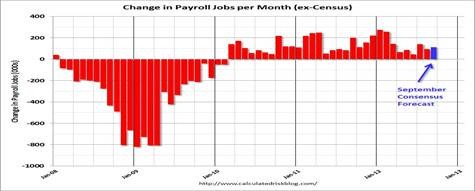
And, total nonfarm payroll employment for July was revised upward from +141,000 to +181,000, and the change for August was revised from +96,000 to +142,000. Employment growth has now averaged 146,000 per month in 2012, vs. 153,000 in 2011.

So how severe was the Great Recession, as compared with the rest of the world? Calculated Risk brought up Harvard Economists Kenneth Rogoff and Carmen Reinhart’s study that showed the seven most severe downturns in modern history. Finland seems to have fared the worst in 1991 with job growth not restored for 17 years, whereas our 1929 Great Depression took 10 years to recover.

clip_image006

Graph: Oregon.gov

So looked at from that point of view, the Great Recession is barely a blip on the world screen in terms of the percentage of unemployed, but it could last a total of 7 years, according to most economists (to 2014) before the employment deficit is made up.

Harlan Green © 2012

Posted in Consumers, Economy, Macro Economics, Weekly Financial News | Tagged , , , , | Leave a comment

Foreclosures Down, Mortgage Activity Surging

The Mortgage Corner

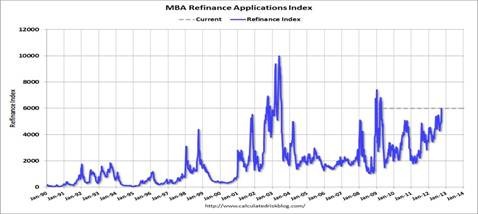
The Mortgage Bankers Association reported that its Refinance Index increased 20 percent from the previous week. This was the highest Refinance Index recorded in the survey since April of 2009. The seasonally adjusted Purchase Index increased 4 percent from one week earlier. This is while foreclosure rates continue to drop according to Lenders Processing Services (LPS).

“Refinance application volume jumped to the highest level in more than three years last week as each of the five mortgage rates in MBA’s survey dropped to new record lows in the survey,” said Mike Fratantoni, MBA’s Vice President of Research and Economics. “Financial markets continue to adjust to QE3, as the ongoing presence of the Federal Reserve as a significant buyer of mortgage-backed securities applies downward pressure on rates.”

clip_image002

Graph: Calculated Risk

The Federal Reserve has just initiated its QE3 quantitative easing program to mainly buy mortgage-backed securities on the open market, which is driving mortgage rates to lower record lows. In California, the 30-year conforming fixed rate has dropped to 3.125 percent with 0 origination points, for instance, while the 30-year jumbo conforming fixed is at 3.375 percent for 0 points origination. Zero cost loans are approximately one quarter percent higher to take into account escrow/title closing costs.

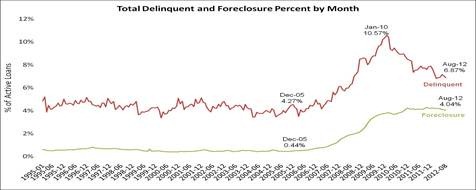
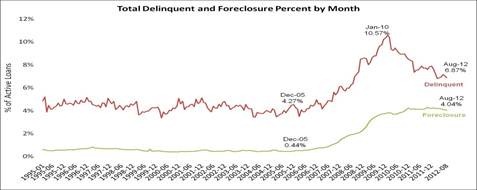
LPS reported that 4.04 percent of mortgages were in the foreclosure process, down slightly from 4.08 percent in July, and down from 4.12 percent in August 2011.

This gives a total of 10.91 percent delinquent or in foreclosure. It breaks down as:
• 1,910,000 properties that are 30 or more days, and less than 90 days past due, but not in foreclosure.
• 1,520,000 properties that are 90 or more days delinquent, but not in foreclosure.
• 2,020,000 loans in foreclosure process.
For a total of ​​5,450,000 loans delinquent or in foreclosure in August. This is down from 5,562,000 last month, and down from 6,080,000 in August 201, according to Calculated Risk.

clip_image004

Graph: Calculated Risk

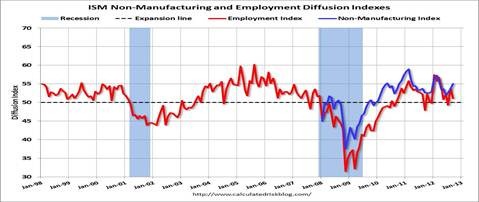
We are also seeing overall economic activity accelerating. The ISM manufacturing index saw a huge boost after 3 down months to a 51.5 percent reading for manufacturing activity. And the September ISM Non-manufacturing index just reported in at 55.1 percent, up from 53.7 percent in August, thought the employment index decreased in September to 51.1 percent, down from 53.8 percent in August. Note: Above 50 indicates expansion, below 50 contraction.

clip_image006

Graph: Calculated Risk

It should be noted that Wrightson-Icap reported the increase was accounted for by a 4.3-point rise in the subjective business activity index and by a four-point jump in the new orders component, leaving both of those measures at their highest levels since last winter. The gain in the subjective index is somewhat surprising in view of the uncertainty associated with the impending fiscal cliff, which so far does not appear to be weighing heavily on sentiment.

This should not be surprising as the so-called “confidence fairies” have been saying for years now that the budget deficit would cause interest rates to skyrocket, when instead they have fallen to record lows. Why? The high unemployment rate has kept consumers, who power 70 percent of economic activity, from consuming more. Hence the Fed’s QE3 program, which is specifically designed to not only revive housing, but put more people back to work.

So we see the Federal Reserve’s commitment to keep interest rates at historic lows for as long as it takes is already taking effect with even lower record mortgage rates. Fed Chairman Bernanke has even stated he wants to bring the unemployment rate down to more acceptable levels, such as 6 percent. This will not be easy, but with the housing market reviving, the Fed’s job will be easier.

Harlan Green © 2012

Posted in Economy, Housing, housing market, Weekly Financial News | Tagged , , , , | Leave a comment

Jobs Picture Much Better Than Forecast

Popular Economics Weekly

The Bureau of Labor Statistics gave markets a shot of good news recently, when it revised the one year March-to-March 2012 jobs totals upward by 32,000 per month. This was huge and showed much better jobs growth than initially forecast by the Labor Dept., with the private sector providing 453,000 additional jobs March-to-March Q1, and a 386,000 net total with government job losses included. We have to wait until this Friday to know if September’s unemployment report more accurately reflects the current unemployment picture.

clip_image002

Graph: Calculated Risk

In fact, we may be seeing the BLS under estimating job formation again this year, as Q2 job growth was less, but all indicators are that it will improve this fall. For instance, weekly initial jobless claims fell a very sharp 26,000 to 359,000 in the week of Sept. 22, while consumers are spending more going into the holidays and the latest manufacturing report was very positive with increased hiring. The largest upward revisions were in Trade, Transportation, and Utilities, followed by Construction, Leisure and Hospitality jobs.

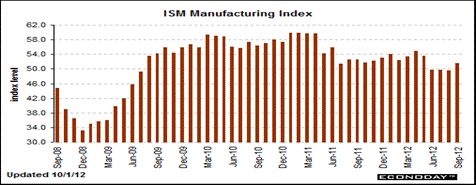
The ISM manufacturing index saw a huge boost after 3 down months to a 51.5 percent reading for manufacturing activity.

clip_image004

Graph: Econoday

Details back the optimism with new orders, at 52.3, showing solid growth. Employment is the big plus in the September report, rising 3.1 points to a 54.7 level that indicates a surprisingly brisk pace of hiring. Negatives include a fourth month of contraction for new export orders, which reflects weak global markets, and a sixth straight contraction in total backlog orders.

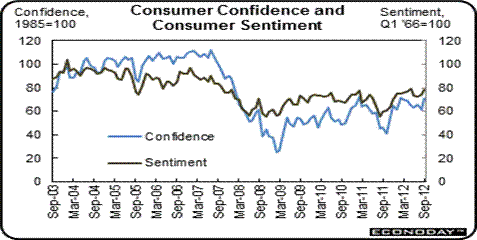
Another sign of improving jobs picture was the jump in consumer optimism. The Conference Board’s consumer confidence index showed the consumer mood improved in September, jumping a very strong nine points to 70.3. This was the best reading since February and the third best reading of the whole recovery, said Econoday.

clip_image006

This report stressed the consumer’s improved assessment of the jobs market. Those saying jobs are currently hard to get fell seven tenths to 39.9 percent, which is the best reading since April. Those saying that jobs are plentiful rose, up 1.1 percentage points to a still however very modest 8.3 percent. Backing up these current readings was strength in the consumer’s outlook for the jobs market where more see more jobs ahead and substantially fewer see fewer jobs.

So we have reason to believe both jobs and economic growth will accelerate in the coming months. Then there is the Federal Reserve’s commitment to keep interest rates at historic lows for as long as it takes to bring the unemployment rate down to more acceptable levels, such as 6 percent. This will not be easy, with Bernanke warning that the deadlocked Congress needs to provide some fiscal stimulus as well. We know austerity doesn’t work from the European example.

Harlan Green © 2012

Posted in Consumers, Economy, Keynesian economics, Macro Economics, Politics, Weekly Financial News | Tagged , , , | Leave a comment

Romney’s 47 Percent Solution

Popular Economics Weekly

We know that Mitt Romney at a Florida fundraiser claimed that there are 47 percent of the people who will vote for President Obama no matter what, and “my job is not to worry about those people. I’ll never convince them they should take personal responsibility and care for their lives,” quoted Mother Jones Magazine in the news coup of the year.

But really, why isn’t he worried about them? Because due to record income inequality, age, the recession, or disabilities, they have the least amount of wealth, and we know he is really about continuing to redistribute the wealth upward since the advent of government-is-the-problem, trickle-down economics of President Reagan.

As the Center for Budget Policy and Priorities has said: “Given all the talk about who does or doesn’t pay federal income taxes and what this means for tax policy, here are a few basic facts.

• The vast majority (83 percent) of households who owe no federal income taxes are either working households that pay payroll taxes (61 percent) or elderly (22 percent).

• The remaining 17 percent of those who don’t pay federal income taxes are mostly those who are not working due to illness or disability, or are in school.

His program, which I call the ’47 percent solution,’ will in fact further impoverish the 47 per cent who don’t pay federal income taxes by continuing to cut back on the federal safety net of social security and Medicare. It does so by adhering to the Republican Party Platform, a combination of his 5-Point Plan and that of Veep candidate Paul Ryan, which is the only Republican budget plan with any detail that was passed by the House.

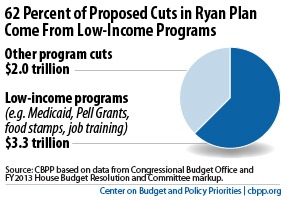
“House Budget Committee Chairman Paul Ryan’s budget plan would get at least 62 percent of its $5.3 trillion in nondefense budget cuts over ten years (relative to a continuation of current policies) from programs that serve people of limited means said the CBPP. “This stands a core principle of President Obama’s fiscal commission on its head and violates basic principles of fairness.”

clip_image001

Whereas the core principal of Republican ideology is that the wealthiest create jobs and so most wealth should flow to them, hence the “trickle-down’ name. But in fact too much debt, both private and public, caused our greatest recession. What built up so much debt? The so-called trickle-down economics of Presidents Reagan and Bush II that ran up the largest budget deficits since World War II with meager economic growth to show for it.

President Clinton even said it at the Democratic convention. Democrats who believe that government has to work for the people have ‘outgrown’ Republican administrations over the past 52 years. “We Democrats think the country works better with a strong middle class, real opportunities for poor people to work their way into it and a relentless focus on the future, with business and government working together to promote growth and broadly shared prosperity. We think ‘we’re all in this together’ is a better philosophy than ‘you’re on your own.’

Who’s right? Well since 1961, the Republicans have held the White House 28 years, the Democrats 24. In those 52 years, our economy produced 66 million private sector jobs. What’s the jobs score? Republicans 24 million, Democrats 42 million!”

Neither trickle-down economics, nor the wealth redistribution upward that accompanies it have been good for the country, such as Romney’s 47 percent solution.

Harlan Green © 2012

Posted in Consumers, Economy, Politics, Weekly Financial News | Tagged , , , , , | Leave a comment

Existing-Home Sales Improve

Financial FAQs

Home resales rose in August to their highest rate in more than two years and groundbreaking on new homes also climbed, signs that a budding housing market recovery is gaining traction. The National Association of Realtors said that existing home sales increased 7.8 percent last month to an annual rate of 4.82 million units.

This is while housing starts rose 2.3 percent last month to an annual rate of 750,000 units, the Commerce Department said.

And with 30-year conforming fixed rates now 3.25 percent for less than a 1 point origination fee in California, it looks like the Fed’s QE3 promise of low mortgage rates for as long as it takes will help to speed up the housing recovery.

Total existing-home sales, which are completed transactions that include single-family homes, townhomes, condominiums and co-ops, rose 7.8 percent to a seasonally adjusted annual rate of 4.82 million in August from 4.47 million in July, and are 9.3 percent higher than the 4.41 million-unit level in August 2011.

clip_image002

Graph: Inside Debt

And housing inventory decreased 18.2 percent year-over-year in August from August 2011. This is the eighteenth consecutive month with a YoY decrease in inventory, said Calculated Risk, and is boosting housing prices. Months of supply declined to 6.1 months in August.

The national median existing-home price for all housing types was $187,400 in August, up 9.5 percent from a year ago. The last time there were six back-to-back monthly price increases from a year earlier was from December 2005 to May 2006. The August increase was the strongest since January 2006 when the median price rose 10.2 percent from a year earlier.

Nationwide housing production rose 2.3 percent to a seasonally adjusted annual rate of 750,000 units in August, according to newly released figures from HUD and the U.S. Census Bureau. This increase was fueled entirely by gains in the single-family sector, where the pace of new construction rose in every region for a combined 5.5 percent gain to 535,000 units.

clip_image004

Graph: Calculated Risk

“Builders across the country have been reporting noticeable improvement in the number of serious buyers who are in the market for a new home, and today’s report shows that this is translating to some welcome gains in construction activity,” said Barry Rutenberg, chairman of the National Association of Home Builders (NAHB). “While there is still plenty of room for improvement, it’s encouraging to see this continuing trend that is spurring much-needed job growth.” For every 100 new single-family homes that are built, 300 new jobs are created, he noted.

At 535,000 units, single-family housing production hit its fastest seasonally adjusted annual pace in more than two years this August. Meanwhile, multifamily housing production declined 4.9 percent to a seasonally adjusted annual rate of 215,000 units.

Calculated Risk says total starts are up 57 percent from the bottom start rate, and single family starts are up 51 percent from the low. Right now starts are on pace to be up about 25 percent from 2011. Also note that total permits are up sharply from last year. So we can see that single-family construction has to double to reach the longer term 1 million unit mark average since 1962.

We can also see from the Calculated Risk graph that the housing bubble really took off beginning in 1992 and peaked in 2006, so it could be 10 years—2019—before that 1 million unit new-home construction volume is again reached.

Harlan Green © 2012

Posted in Economy, Housing, housing market, Weekly Financial News | Tagged , , , , | Leave a comment

Bernanke’s QE3 Challenge

Popular Economics Weekly

Should we call him King Ben? Much like King Arthur, Fed Chairman Bernanke and his Roundtable of Fed Governors have taken on the confidence fairies, to use Paul Krugmans’s term, the austerity promoters who believe the only way to run an economy is with little debt, and even less government.

In fact here is no question that the Fed’s QE3 stimulus will boost economic growth, has already boosted growth by keeping interest rates at historic lows. Those, such as the rating agencies who believe Quantitative Easing has little or no effect on employment or economic growth understand very little about macro economics, or economic growth in general.

Bernanke has in effect thrown down the gauntlet, not only to U.S. banks and investors who are hoarding their cash, but to Euro Zone countries that believe austerity is the way to financial health, by saying the Fed will do whatever it takes for almost an unlimited amount of time to spur employment and economic growth.

We can already see the results of QE3 in the plunge of both short and long term Treasury rates, as well as the rise in the euro to 1.32 to the dollar in just one day. It will make U.S. products cheaper all around, and European products more expensive, thus boosting U.S. exports and manufacturing.

By the same token, Bernanke is telling all those corporations and investors sitting on their hands, that he can and will outwait them. That is, the Fed will keep rates this low until they call ‘uncle’, which is another way of saying until employment and economic growth have returned to more normal levels. If they choose to stay on the sidelines, in other words, they will ultimately pay the price in reduced profits, because they will have been left behind in the ultimate recovery.

The FOMC press release said it very succinctly: “If the outlook for the labor market does not improve substantially, the Committee will continue its purchases of agency mortgage-backed securities, undertake additional asset purchases, and employ its other policy tools as appropriate until such improvement is achieved in a context of price stability.”

The door was opened to QE3’s implementation after the European Central Bank okayed an open-ended purchase of sovereign country bonds with terms up to 3 years, which means it is finally taking steps to bring down interest rates in Spain and Italy, in particular.

There was also another reason for the Fed’s actions. Manufacturing weakened in August for industrial production overall, led by mining and utilities. And manufacturing employment has been growing over the past year. Overall industrial production fell 1.2 percent, following a 0.5 percent jump in July (originally up 0.6 percent). Overall capacity utilization slipped to 78.2 percent from 79.2 percent in July. The consensus forecast was 79.2 percent, said Econoday. This has to concern the Fed, which wants it closer to the long term utilization rate of 80.3 percent.

image

Graph: Econoday

Probably the most convincing evidence that Quantitative Easing works is the albeit slow revival of housing sector. Economists are agreed that the collapse of housing values has been a major deterrent to consumer spending. This could be the year that housing finally begins to recover, as the major housing prices indexes all show substantial gains, while foreclosures have fallen 23 percent in a year.

image

Graph: Econoday

“One of the goals of Fed quantitative easing and Operation Twist (which brought down longer-term rates, including mortgage rates) is to boost asset prices.  There has been a clear rebound in equity prices since the recession and nice Fed policy is impacting asset prices in the housing market,” said Econoday.

In other words, home prices are clearly on the recovery with Case-Shiller reporting a 0.9 percent rise in June for its 20-city index which followed a robust 1.0 percent gain the prior month. The latest reading was the fifth rise in a row and the fourth very strong rise in a row. The year-on-year rate, at plus 0.5 percent, shows its first positive reading in nearly 2 years. Gains swept 18 of the 20 cities led by a sharp rebound for Detroit and a third straight monthly rebound for Atlanta. West Coast cities also show strong gains.

Housing isn’t the only sector that affects consumers, of course. Household incomes, which have fallen since 2000, have to rise again. But that will only happen when the demand for new jobs grows, which is the real target of Sir Ben’s QE3 challenge.

Harlan Green © 2012

Posted in Economy, Housing, housing market, Politics, Weekly Financial News | Tagged , , , , , , | Leave a comment

Home Builder’s Confidence at High

The Mortgage Corner

This is very big news. Builder confidence in the market for newly built, single-family homes rose for a fifth consecutive month in September to a level of 40 on the National Association of Home Builders/Wells Fargo Housing Market Index (HMI), released today. This latest three-point gain brings the index to its highest reading since June of 2006.

It’s due in part to the extremely low new-home inventory, which is back to 1980’s levels, as well as the Fed’s announced intentions of maintaining rock bottom mortgage rates until mid-2015, if you believe the latest FOMC press release.

clip_image002

Graph: Econoday

Builder confidence rose across every region of the country in September. Looking at the three-month moving average for each region, the Midwest and West each registered five-point gains, to 40 and 43, respectively, while the South posted a four-point gain to 36 and the Northeast posted a two-point gain to 30.

“Builders across the country are expressing a more positive outlook on current sales conditions, future sales prospects and the amount of consumer traffic they are seeing through model homes than they have in more than five years,” noted NAHB Chief Economist David Crowe. “However, against the improving demand for new homes, concerns are now rising about the lack of building lots in certain markets and the rising cost of building materials. Given the fragile nature of the housing and economic recovery, these are significant red flags.”

Constructing spending is also stronger, as is new home sales, especially single family construction. New one-family structures rose 1.5 percent, following a 3.1 percent boost the prior month.  New multifamily structures advanced 2.8 percent after a 3.5 percent increase in June.  So, the recent uptrend in housing starts was not misleading.  Spending on new private residential structures continues to improve.

clip_image004

Graph: Econoday

Homebuilders are becoming more optimistic because new home sales were up 3.6 percent in July to an annual unit rate of 372,000. This is the best of the recovery outside of stimulus driven sales in the spring of 2010.

clip_image006

Graph: Econoday

The rise in total sales is drawing down supply, which explains the very strong readings in the monthly home builders’ housing market index. Supply at the current sales rate is 4.6 months which is down from 4.8 months in June and compares with 6.7 months a year ago. Low supply of new homes points to increased building activity ahead and to gains for construction employment.

Lastly, it really looks like Ben Bernanke and his Board of Governors’ open-ended “QE3” $40 billion per month bond-buying program will give housing the boost it needs to finally take off with such low mortgage rates for years to come.

The FOMC press release said it very succinctly: “If the outlook for the labor market does not improve substantially, the Committee will continue its purchases of agency mortgage-backed securities, undertake additional asset purchases, and employ its other policy tools as appropriate until such improvement is achieved in a context of price stability.”

Harlan Green © 2012

Posted in Consumers, Economy, Housing, housing market, Weekly Financial News | Tagged , , , , , | Leave a comment

Income Inequality Behind Most Poverty

Financial FAQs

There were 46.2 million Americans in poverty in 2011, as median household income decreased to its lowest level since 2000, according to a Census Bureau report released this week that illustrated the toll from ongoing labor-market weakness.

The main culprit is the still high unemployment rate of 8.1 percent 3 years after the end of the Great Recession. But two other factors play a big part in creating the record poverty—the slow real estate recovery from its worst bust since the Great Depression, and growing inequality. The top 10 percent had the only income increases in 2011, according to U.S. Census figures.

Actually, both the unemployment rate and housing would be recovering much faster if inequality wasn’t so high. A recent column in Popular Economics Weekly highlighted what has happened since the 1970s to create the record inequality—plunging incomes of the middle class, for one, in both the private and public sectors, largely due to a blend of less progressive taxation and wholesale deregulation that has created a much more monopolistic corporate structure. This has diverted more corporate profits to investors and corporate CEOs. It is a lesson few policy makers seem to have learned. Even Henry Ford knew the importance of growing incomes for everyone back in 1914, as I have said, when he raised his workers’ salaries to the “unheard of salary” of $5 per day, so that they could afford to buy his Model T’s.

clip_image002

Graph: DShort.com

And Nobelist Joe Stiglitz highlighted the results of such inequality in his latest book, “The Price of Inequality”. “I won’t run through all the evidence here, except to say that the gap between the 1 percent and the 99 percent is vast when looked at in terms of annual income,” he said in a Vanity Fair article, “and even vaster when looked at in terms of wealth—that is, in terms of accumulated capital and other assets.”

Such inequality has caused many of the economic ills of the past decade, including the two most recent recessions. “It is no accident that the periods in which the broadest cross sections of Americans have reported higher net incomes—when inequality has been reduced, partly as a result of progressive taxation—have been the periods in which the U.S. economy has grown the fastest. It is likewise no accident that the current recession, like the Great Depression, was preceded by large increases in inequality. When too much money is concentrated at the top of society, spending by the average American is necessarily reduced—or at least it will be in the absence of some artificial prop.”

Except for the Federal Reserve’s just announced action to implement “QE3” through 2015, nothing is being done to create more jobs with a Congress and White House deadlocked on whether tax cuts or stimulus spending is more important.

So the situation is dire, needless to say, which is why the Federal Open Market Committee extended it credit easing period into 2015. “To support continued progress toward maximum employment and price stability, the Committee expects that a highly accommodative stance of monetary policy will remain appropriate for a considerable time after the economic recovery strengthens. In particular, the Committee also decided today to keep the target range for the federal funds rate at 0 to 1/4 percent and currently anticipates that exceptionally low levels for the federal funds rate are likely to be warranted at least through mid-2015.”

Bernanke also pronounced the maximum employment target was around 6 percent, a full 2 percent drop from the current 8.1 percent, which in effect probably wouldn’t happen until at least 2015. That, combined with the ongoing euro problems and softness in China’s economy were what probably spurred the Fed to further actions.

So there is a direct connection between too much inequality and high unemployment. Professor Stiglitz said it best in the Vanity Fair article.

“It is no accident that the periods in which the broadest cross sections of Americans have reported higher net incomes—when inequality has been reduced, partly as a result of progressive taxation—have been the periods in which the U.S. economy has grown the fastest,” said Stiglitz. “It is likewise no accident that the current recession, like the Great Depression, was preceded by large increases in inequality. When too much money is concentrated at the top of society, spending by the average American is necessarily reduced—or at least it will be in the absence of some artificial prop. Moving money from the bottom to the top lowers consumption because higher-income individuals consume, as a fraction of their income, less than lower-income individuals do.”

Many are now voicing a growing concern on what record inequality has already done to U.S. economic growth and our position in the world, especially over the past decade.  Now it is really up to ordinary Americans to get that message to the policymakers who will make a difference, who understand that our economy only works when all citizens are able to participate in its benefits.

Harlan Green © 2012

Posted in Consumers, Economy, Macro Economics, Politics, Weekly Financial News | Tagged , , , , , , , , , , | Leave a comment

Why Do We Need QE3?

Financial FAQs

It’s not hard to see why we need “QE3”, the Fed’s bond buying program to keep long term interest rates low. It’s almost an act of desperation. The Fed is the only game in town to stimulate growth at the moment, when we are teetering on the edge of several ‘fiscal cliffs’.

That is, the private sector is not creating enough jobs on its own to pay down the budget deficit, or maintain a secure social safety net. In fact, the unemployment rate has to fall at least 2 points—close to 6 percent—to bring us near full employment and an economy that returns us to prosperity. The U.S. economy is also dealing with the prospect of another credit downgrade that could endanger our fiscal solvency.

“The stagnation of the labor market in particular is a grave concern not only because of the enormous suffering and waste of human talent it entails,” said Fed Chairman Ben Bernanke at the Fed’s annual Jackson Hole conference, “but also because persistently high levels of unemployment will wreak structural damage on our economy that could last for many years.”

image

Graph: Calculated Risk

There were just 96,000 payroll jobs added in August, with 103,000 private sector jobs added, and 7,000 government jobs lost. A meager total much below the first part of the year. The unemployment rate decreased to 8.1 percent (from the household survey), and the participation rate declined to 63.5 percent, mostly from the decline in manufacturing employment, which depends on exports which have flagged of late.

The reason for “persistently high levels of unemployment” is not a mystery. Incomes of the 80 percent of wage and salary earners whose spending powers most economic growth have fallen with no relief in sight when productivity gains are soaring. The problem is very little of those gains are flowing to the workers producing those goods and services.

From 1948 to 1973, the productivity of all nonfarm workers nearly doubled, as did average hourly compensation.  Although productivity increased by 80.1 percent from 1973 to 2011, average wages rose only 4.2 percent and hourly compensation (wages plus benefits) rose only 10 percent over that time, according to government data analyzed by the Economic Policy Institute.

That is a lesson that seems to have been lost at least since the 1970s. So until programs that stimulate actual job growth are enacted, there won’t be much more job growth, in spite of the Fed’s best efforts.

What programs are needed? This is also self-evident. Programs that decrease the record income inequality, the worst since the 1920s. And can be government-led, at the moment, without increasing the deficit. That is the misinformation being spread by those who do not understand growth. Romney, Ryan, et. al., don’t seem to realize that spending tax dollars on infrastructure, education, fire, police, healthcare, and the like, are actually dollars spent in the private sector that are deficit neutral. It’s called pay-as-you-go, the congressional rule that any spending increase had to be matched with a revenue increase. This rule that served President Clinton so well and enabled 4 consecutive budget surpluses, was only abandoned in 2000 when the Bush-Cheney administration cut taxes while increasing spending.

The huge inequality gap has reached historical levels not seen since 1928, which has depressed demand for the goods that drive growth. Economic historians such as Professor James Livingston, in particular, have known this. Private investment has been diminishing as a share of GDP since 1900. “So corporate profits do not drive economic growth — they’re just restless sums of surplus capital,” said Livingston, “ready to flood speculative markets at home and abroad. In the 1920s, they inflated the stock market bubble, and then caused the Great Crash. Since the Reagan revolution, these superfluous profits have fed corporate mergers and takeovers, driven the dot-com craze, financed the “shadow banking” system of hedge funds and securitized investment vehicles, fueled monetary meltdowns in every hemisphere and inflated the housing bubble.”

The policies that created such weak payroll numbers cannot be allowed to continue. Fed Chairman Bernanke and his Board of Governors are the only federal officials able to act at a time when our economic health hangs in the balance.

Harlan Green © 2012

Posted in Consumers, Economy, Macro Economics, Politics, Weekly Financial News | Tagged , , , , , , , , , , | Leave a comment