Are Home Prices Moderating?

The Mortgage Corner

There are small signs of a slowdown in the rise of housing prices. Core Logic, a real estate data provider, sees some moderation in this New Year.

“As we close 2021, housing market indicators, including S&P CoreLogic Case-Shiller Index, suggest that the housing market will have another strong year in 2022. While the expected slowing of home price growth suggests overall annual appreciation in 2022 will fall shorter than that of 2021, the annual average of 7% is still higher than the average 5% seen between 2010 and 2020.”

CensusBureau-CalculatedRisk

Housing’s annual price appreciation is slowing in part because new construction is making up some of the housing shortage.

Calculated Risk reports that on a year-over-year basis, private residential construction spending is up 16.3% (red line in graph). Non-residential spending is up 6.7% year-over-year. Public spending is down 0.8% year-over-year.

This is resulting in single‐family housing starts in November to jump 11.3 percent above the revised October figure of 1,054,000.

But inventories are still at rock bottom, with unsold inventory at a 2.1-month supply in November, the lowest since January. That’s even lower than 2.3 months in the same month last year, and a 4-to-6-month supply of homes for sale during more normal times.

That is making NAR chief economist Lawrence Yun cautious about affordability in the New Year:

“Buyer competition alone is unrelenting, but home seekers have also had to contend with the negative impacts of supply chain disruptions and labor shortages this year,” he said. “These aspects, along with the exorbitant prices and a lack of available homes, have created a much tougher buying season.”

How long could it take for the supply of homes available to purchase catch up the demand? It depends on when more working age adults return to the workforce and suppply chains become unchained.

The labor shortages may improve this New Year. As a predictor of Friday’s unemployment report private payrolls rose by 807,000 in December, according to the ADP National Employment Report released Wednesday. That’s the strongest gain since May.

Service sector providers added 669,000 jobs in December. Leisure and hospitality added 246,000 workers. Meanwhile, goods producers added 138,000 jobs, the strongest gain of the year. Manufacturing added 74,000 jobs.

This could begin to improve the housing supply.

Then we must wait for the supply-chains to recover as countries ramp up production and the various trade tariffs reduced that have driven up the cost of building materials, with lumber prices still higher than in pre-pandemic times.

Harlan Green © 2021

Follow Harlan Green on Twitter: https://twitter.com/HarlanGreen

Posted in Consumers, COVID-19, Economy, Housing, housing market, Weekly Financial News | Leave a comment

Hires Increase in November JOLTS Report

Financial FAQs

Calculated Risk

The Bureau of Labor Statistics reported that job openings decreased in November to 10.6 million from 11.1 million in October (yellow line in above graph).

It’s a sign that more workers are returning to work. So huge is the U.S. job market that hiring rose by 191,000 jobs to 6.7 million in November. The hiring rate rose to 4.5 percent from 4.4 percent in the prior month.

The BLS said:

“On the last business day of November, the number and rate of job openings decreased to 10.6 million (-529,000) and 6.6 percent, respectively. Job openings decreased in several industries with the largest decreases in accommodation and food services (-261,000); construction (-110,000); and nondurable goods manufacturing (-66,000). Job openings increased in finance and insurance (+83,000) and in federal government (+25,000). The number of job openings decreased in the South and Midwest.”

This suggests that hiring in both the service and manufacturing sectors is picking up, a good sign for continuing job growth in 2022.

The number of job openings (yellow) were up 56 percent year-over-year. Quits were up 37 percent, year-over-year. The JOLTS report showed that people quitting their jobs rose by 370,000 to 4.5 million in November.  The quits rate rose to 3 percent from 2.8 percent in October, matching the highest quits rate of the pandemic era.

The U.S. unemployment reports comes out this Friday and will give a better picture of the New Year, but the JOLTS report gives a preliminary indication, though it lags almost one month behind the unemployment report.

Another indicator of future job prospects is the decline in weekly initial jobless claims for unemployment as unemployment benefits expire.

FREDinitialclaims

Weekly claims are down from their high of 6 million during the pandemic to 198,000 in the latest week. Salaried employees can’t wait much longer to return in greater numbers in the New Year after spending the excess savings accumulated during the pandemic.

Nobel laureate Paul Krugman has the last word this week in a recent NY Times column, in comparing the swiftness of this jobs recovery to President Reagan’s 1982 recovery which Reagan called “morning in America” that boosted his 1984 reelection.

“Yes, by this measure (and many others) we’re in the middle of another morning in America, despite the drag caused by a lingering pandemic and supply-chain disruptions,” said Professor Krugman.

With this kind of a jobs recovery, what should economic growth look like going forward?

The Atlanta Federal Reserve’s GDPNow model estimate for real GDP growth (seasonally adjusted annual rate) in the fourth quarter of 2021 is 7.4 percent on January 4, down from 7.6 percent on December 23, says their press release.

So overall, 2021 real GDP growth could be upwards of 5 percent. The last time it reached this height was in the 1980s. And since this is the beginning of another year, we can call it the morning of a successful 2022 New Year.

Harlan Green © 2022

Follow Harlan Green on Twitter: https://twitter.com/HarlanGreen
Posted in Consumers, COVID-19, Economy, Weekly Financial News | Leave a comment

Here’s To a Lasting Housing Recovery!

The Mortgage Corner

Since it is the holidays, I want to propose a New Year’s toast to a lasting housing recovery.

Firstly, home builders are beginning to play catchup with the housing shortage that has plagued those wanting a place to live since the end of the Great Recession and busted housing bubble. That’s when construction ground to a halt because one million more homes were built than were needed at the time.

Does this mean the housing market could begin a decade-long recovery as has happened in the past? It’s possible. Consumers are flush with cash from the pandemic aid and the personal savings rate is still at a post-recession high (6.9 percent).

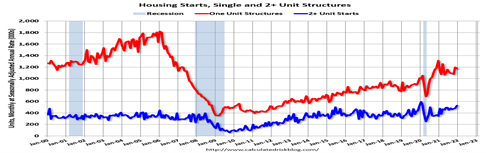
More than 1,800,000 housing units per year were constructed during the height of the housing bubble in 2006 (see below graph), which fell to just 400,000 units annually during the Great Recession in 2008 (gray bar), which is part of the reason for the current housing shortage.

The last two recoveries lasted approximately 10 years. So why not toast the possibility that this may be a housing recovery that might last, if the other roadblocks to a housing recovery, labor material shortages should ease next year?

CalculatedRisk

Construction is booming, which should begin to fill the very low inventory of homes for sale, despite the labor and material shortages.

“Single‐family housing starts in November were at a rate of 1,173,000; this is 11.3 percent above the revised October figure of 1,054,000. The November rate for units in buildings with five units or more was 491,000,” according to the Census Bureau.

Calculated Risk

Rising existing-home sales are also helping to fill the housing void. Existing-home sales rose 1.9 percent to a seasonally adjusted annual rate of 6.46 million in November, the National Association of Realtors said Wednesday. That is the third straight monthly gain. And there is room to grow more sales.

More than 7 million existing homes were sold in 2005 at the height of the housing bubble, per the above existing-home sales graph but sales declined to 4 million in 2008 during the Great Recession (gray bar in graph).

Unsold existing inventory is at a 2.1-month supply in November, the lowest since January. That’s down from 2.3 in the same month last year, and a 4-6 month supply of homes for sale during more normal times.

“Supply-chain disruptions for building new homes and labor shortages have hindered bringing more inventory to the market,” said NAR chief economist Lawrence Yun. “Therefore, housing prices continue to march higher due to the near record-low supply levels.”

There’s better economic news as well that may help to cure the housing crunch. Third quarter GDP growth was revised up slightly to 2.3 percent, and Q4 growth is projected to be even higher.

Consumer confidence is also on the rise again with the holidays. The index of consumer confidence rose to 115.8 in December from a revised 111.9 in the prior month, The Conference Board said Wednesday.

Lynn Franco, Senior Director of Economic Indicators at The Conference Board said, “The Present Situation Index dipped slightly but remains very high, suggesting the economy has maintained its momentum in the final month of 2021. Expectations about short-term growth prospects improved, setting the stage for continued growth in early 2022. The proportion of consumers planning to purchase homes, automobiles, major appliances, and vacations over the next six months all increased.”

So this is a good time to raise a toast to a continued housing recovery—and a Happier New Year!

Harlan Green © 2021

Follow Harlan Green on Twitter: https://twitter.com/HarlanGreen
Posted in Consumers, COVID-19, Housing, housing market, Weekly Financial News | Leave a comment

This Inflation Can’t Last

FREDcpi

Why the feverish speculation that higher inflation could last beyond next year, and dampen economic growth, when the American economy should otherwise return to a semblance of normalcy? The COVID-induced recession of 2020 lasted just two months and caused one of the deepest economic contractions in history.

The recovery is also one of the fastest in history, so it is causing a temporary climb in inflation. Firstly, consumers and businesses are flush with cash for the holidays. Why wouldn’t they want to spend it now, regardless of the rising prices sure to follow? Expectations are usually high during the holidays.

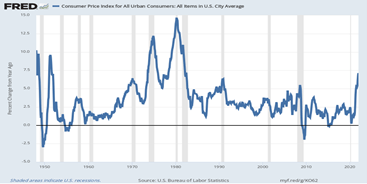
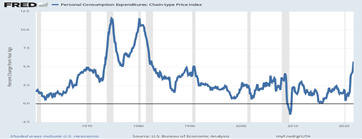
In May 2020 the CPI, seasonally adjusted inflation rate for consumers was a mere 00.22 percent and in November 2021 had risen to 6.9 percent, seasonally adjusted. But there is usually a New Year drop off in spending because consumers want to pay down their credit bills and save for the April tax season. So prices should also subside substantially, as most retail businesses know after the holiday shopping splurge.

There are a few caveats to this forecast, however. The Biden administration is not helping to lower inflation by reducing the Trump trade tariffs. Raising tariffs made more sense when the economy was booming before the pandemic, and we wanted to repatriate U.S. businesses to our homeland to boost American jobs.

But if the supply-chain slowdown is to be improved, smart economic policy says that tariffs should be lowered to increase the flow of international trade, and ease the supply bottlenecks.

Also, Biden’s ‘Buy America”, and “Made in the USA” emphasis will certainly keep prices from falling faster with products made in the USA, as it’s more expensive to produce things in America, vs. overseas.

But is that a reason for markets to panic, so that the Federal Reserve may overreact by raising interest rates too soon next year? I don’t think so.

Economists such as Larry Summers worry about what is called “stagflation”, a holdover from the 1970s fast rising prices for oil and other commodities that caused unions to follow suit and the Federal Reserve to maintain policies (such as keeping interest rates low) that tolerated higher wages and salaries.

That’s not the case anymore, mainly because unions are much weaker so that wage and salary increases have been kept down, which is a large part of any inflationary spiral.

So the other causes of higher inflation—supply-chain bottlenecks and a shortage of workers—could still be problems.

Nobel Laureate Paul Krugman cites Biden’s Council of Economic Advisors in a recent NY Times Op-ed who believe that this bout of higher inflation most resembles that of 1946-48, when the American economy hadn’t yet geared up to meet soaring consumer demand when also flush with cash from WWII savings.

But there won’t be such a wholesale conversion from a wartime to a peacetime economy in the pandemic recovery. In fact, we will be fast forwarding to an enhanced digital economy with much more reliance on 5G networks and Artificial Intelligence, and less dependence on workers to produce things.

As if to presage such a future the Conference Board’s latest Index of Leading Economic Indicators predicts good growth ahead, with or without the availability of more workers.

“The Conference Board Leading Economic Index® (LEI) for the U.S. increased by 1.1 percent in November to 119.9 (2016 = 100), following a 0.9 percent increase in October and a 0.3 percent increase in September,” stated its latest press release.

“The U.S. LEI rose sharply again in November, suggesting the current economic expansion will continue into the first half of 2022,” said Ataman Ozyildirim, Senior Director of Economic Research at The Conference Board. “Inflation and continuing supply chain disruptions, as well as a resurgence of COVID-19, pose risks to GDP growth in 2022. Still, the economic impact of these risks may be contained. The Conference Board forecasts real GDP growth to strengthen in Q4 2021 to about 6.5 percent (annualized rate), before moderating to a still healthy rate of 2.2 percent in Q1 2022.”

This prediction of a huge jump in future growth is based on 12 hard data indicators such as stock prices, interest rate spreads, and consumer credit flows, which lends more credence to its prediction of future trends—and to the fact that supply-chain disruptions and future employment trends may not be major factors affecting inflation next year.

So worrying about some kind of long-lasting inflationary spiral doesn’t make sense to me

Harlan Green © 2021

Follow Harlan Green on Twitter: https://twitter.com/HarlanGreen

Posted in Consumers, COVID-19, Economy, Weekly Financial News | Leave a comment

Are Interest Rates Too Low?

The Mortgage Corner

Should home buyers worry about the record-low interest rates in the near or distant future?

Because interest rates are at post-World War II lows, the super cheap money is helping to drive up annual home price rates into double digits, resulting in a loss of affordability for many prospective homebuyers and even renters.

And the Federal Reserve is reluctant to raise interest rates, fearing it will collapse the recovery with COVID variants not yet vanquished.

FRED30yrmortgage

The 30-year conforming fixed mortgage rate favored by most home buyers has been declining since the early 1980s, and has hovered around 3 percent since the start of the pandemic, per the above Federal Reserve Bank of St. Louis (FRED) graph.

It is a major reason the S&P CoreLogic Case-Shiller U.S. National Home Price NSA Index of single-family, same home, price changes reported a 19.5 percent annual gain in September 2021, though slightly down from 19.8 percent in August. The S&P Index is a 3-month average for 20 metropolitan areas, so in some cities home prices are rising even faster.

“It’s unprecedented for us to get a massive run-up in home prices during a recession,” says Freddie Mac’s chief economist, Sam Khater. “It’s clear that [mortgage] rates matter even more than unemployment rates.”

Another reason for the price run-up is that inflation is soaring as well. The retail Consumer Price Index, seen below in the 2nd FRED graph, is up 6.8 percent in November Y-o-Y when it has averaged just 2 percent since the Great Recession.

FREDcpi

And if said inflation remains much higher than interest rates (3 percent vs. 6.8 percent inflation), it means in effect negative interest rates since higher inflation reduces the value of the loan principal over time. And that pours gas on the exploding home prices.

This is not an easy concept to understand, but it happened during the housing bubble when housing prices were also rising in the double digits annually.

Soaring inflation is the other problem, and that probably won’t decline until the labor and supply-chain shortages subside sometime next year.

So should home buyers wait for this housing price bubble to subside to buy a home? The National Association of Realtors hasn’t much helping advice.

“Home sales remain resilient, despite low inventory and increasing affordability challenges,” said Lawrence Yun, NAR’s chief economist. “Inflationary pressures, such as fast-rising rents and increasing consumer prices, may have some prospective buyers seeking the protection of a fixed, consistent mortgage payment.”

Is there any good news? The Federal Reserve released the Q3 2021 Flow of Funds report on Thursday: Financial Accounts of the United States. It stated that American households’ net worth is at a record high as a percentage of GDP (more than 600 percent of GDP), increasing $2.3 trillion in Q3, thanks to government spending for the COVID pandemic that is approaching $5 trillion to date with more to come when the Build Back Better Act finally passes.

MarketWatch’s Steve Goldstein cites James Knightley, chief international economist at ING, who put a positive spin on the latest report. From the low point of the first quarter of 2020, household wealth has surged by $35.5 trillion. Combine this wealth rise with employment growth, and wage gains, and the U.S. consumer looks to be in good shape.

The “further massive accumulation of wealth only adds to the potential spending ammunition of the household sector, which gives us more confidence that the U.S. economy can expand by more than 4% in 2022,” says Knightley.

But there’s still a housing shortage that some economists predict could last 10 years. So this has happened before, and only a concerted effort of governments and builders will lessen the housing crunch we are currently experiencing.

Harlan Green © 2021

Follow Harlan Green on Twitter: https://twitter.com/HarlanGreen
Posted in Consumers, COVID-19, Economy, Housing, housing market, Weekly Financial News | Leave a comment

Has COVID-19 Made US Richer?

Financial FAQs

FREDdisposalbleincome

More Americans are richer, thanks to the COVID-19 pandemic, believe it nor not. The pandemic has spurred congress and the Biden administration to act as if we are coming out of another Great Depression.

The U.S. is growing faster than other developed countries that haven’t invested as much in the recovery. And those investments are going to Americans that need it the most.

Just since the American Rescue Plan passed in March 2020, 4.3 million more people have found employment. Wages and real disposable income are up, especially for low-wage workers, who are disproportionately women and people of color and who have experienced consistent wage growth since April 2021, say Rose Khattar and Andres Vinelli of the Center For American Progress, a progressive think tank.

It’s the New Deal all over again, but instead of the 1930s and a looming World War Two, congress and the Biden administration have acted to save the U.S. economy from the worst pandemic since the Spanish flu pandemic of 1918.

FREDgdp

“The U.S. is the only leading advanced economy to have exceeded its pre-pandemic levels, according to the Organization for Economic Co-Operation and Development,” say Khattar and Vinelli. “In fact, data from the most recent quarter shows that our real GDP—which is GDP adjusted for inflation—is around 13% larger than the end of the COVID-19 recession.”

It is largely due to Biden’s American Rescue Plan of last March that especially raised the lowest income brackets. Economist Gene Sperling, its White House Coordinator, says such growth not only helps lower-income folk, but children most of all with the child tax credit that alone has halved the child poverty rate.

And don’t forget the $1400 payments sent out to most Americans at a time when the pandemic lockdowns were in full force.

More evidence of the record post-pandemic growth is that service-oriented businesses making up two-thirds of economic activity—such as banks, retailers and drug stores—grew in November at the fastest pace on record, even as companies grappled with major shortages of labor and supplies.

The Institute for Supply Management’s services PMI climbed to 69.1 percent last month from 66.7 percent in October, when 50 percent is break-even growth, marking the biggest increase on record.

In a rarity, all 18 of the service sectors tracked by ISM said they grew in November. The biggest problem is supplying all the services that customers want. Companies can’t find enough people to fill a near-record number of open jobs. They’ve also struggled to obtain badly needed supplies.

“It goes back to the pent-up demand,” said Anthony Nieves, Chair of the Institute for Supply Management® Services Business Survey Committee. “You can look at other tangible things such as mall traffic and online distribution increasing, which are contributing factors to business activity being up. Many people are going back to work, and consumer confidence is up.”

And if the newest Omicron variant proves less deadly, as initial test results are showing, then there’s nothing to hold back consumers and businesses from building America back better than ever.

Harlan Green © 2021

Follow Harlan Green on Twitter: https://twitter.com/HarlanGreen
Posted in Consumers, COVID-19, Economy, Keynesian economics, Weekly Financial News | Leave a comment

Are We Nearing Full Employment?

Popular Economics Weekly

Calculated Risk

Are we nearing full employment, at least among of those that want to return to work? That may be a strange question to ask when the just-arrived Omicron COVID variant is creating more uncertainty about future US job growth.

But the latest unemployment surveys out today showed that the unemployment rate dropped to 4.2 percent from 4.6 percent, and 537,000 more workers joined the labor force.

I like the Calculated Risk graph above that portrays where we are in the job recovery from 2020 peak employment (red line). We are fast approaching what was full employment then, as opposed to the slow job recovery from the 2007 Great Recession (blue line).

However, just 210,000 new payroll jobs were added to payrolls in the separate Establishment survey, which is seasonally adjusted, and means 210,000 more jobs were created above what is normal for this time of year.

“Total nonfarm payroll employment rose by 210,000 in November, and the unemployment rate fell by 0.4 percentage point to 4.2 percent, the U.S. Bureau of Labor Statistics reported today. Notable job gains occurred in professional and business services, transportation and warehousing, construction, and manufacturing. Employment in retail trade declined over the month.”

But the change in total nonfarm payroll employment for September was revised up by 67,000, from +312,000 to +379,000, and the change for October was revised up by 15,000, from +531,000 to +546,000, so employment in September and October combined is 82,000 higher than previously reported.

We are nearing full employment because most of the job increase was in leisure and hospitality, which had lagged job creation in the durable goods sector earlier in the recovery.

The leisure and hospitality sector gained 23,000 jobs in November. In March and April of 2020, leisure and hospitality lost 8.22 million jobs, and are now down 1.33 million jobs since February 2020. It has now added back about 84 percent of the jobs lost in March and April 2020, says BLS.

MarketWatch

Construction employment increased 31,000, and manufacturing also added 31,000 jobs. State and Local education lost 16,000 jobs, seasonally adjusted, which was a major reason fewer Establishment survey jobs were created.

Nonfarm employment has increased by 18.5 million since April 2020 but is down by 3.9 million, or 2.6 percent, from its pre-pandemic level in February 2020.

So which of the two Labor Department’s surveys—the Establishment vs. the Household surveys—is the most accurate picture of U.S. employment? The Household survey also showed a much larger 1.14 million people found work in November, though it is a smaller survey than the Establishment survey and isn’t seasonally adjusted.

The Labor Department also reported that In November, 3.6 million persons had been unable to work because their employer closed or lost business due to the pandemic–that is, they did not work at all or worked fewer hours at some point in the four weeks preceding the survey due to the pandemic.

So COVID-19 is still putting a big dent in the employment picture, and we must now wait to see what happens this winter with any new variants, to see if the COVID-19 pandemic is tamed and we are able to return to full employment.

Harlan Green © 2021

Follow Harlan Green on Twitter: https://twitter.com/HarlanGreen

Posted in Consumers, COVID-19, Economy, Weekly Financial News | Leave a comment

Americans are Returning to Work

Financial FAQs

FREDselfemployed

Why aren’t more Americans returning to their old jobs? Many are becoming self-employed, thanks to the pandemic that encourages more work from home, and the Internet with its many marketing opportunities.

The Wall Street Journal reports that 10.2 million workers in October, seasonally adjusted, have become self-employed.

“That is the highest total since the financial-crisis year 2008, except for this summer. The total amounts to an increase of 6% in the self-employed, while the overall U.S. employment total remains nearly 3% lower than before the pandemic,” says WSJ.

So maybe the problem isn’t so much that many Americans are retiring, or holding out for better jobs, but that many are finding different career paths. More than 50 percent of Millennials aged 18-22, for instance, have begun their careers self-employed, according to Upwork, Inc.

The use of remote freelancing has also dramatically increased because of the pandemic and will continue to rise in the future, says Upwork. The change to fully remote workforces has led to changes across organizations, far beyond where their workforce is located.

In fact, 67 percent of businesses reported that there were more changes to long-term management practices than a normal year, excluding temporary pandemic-led changes.

“Remote work has become, what economists call, a general-purpose technology,” says Upwork Chief Economist Adam Ozimek. “It has a wide range of uses that is embraced across the economy and creates a variety of spillover effects and we are already seeing the signs of these effects. The embrace of a more fully remote workforce has enabled businesses to embrace new technology, reimagine how they onboard and train, and even allowed hiring managers to embrace the use of freelancers.”

FRED

And today’s ADP payroll report said private sector employment increased by 534,000 jobs from October to November according to the November ADP® National Employment ReportTM.

This could be a predictor of the official Labor Department report on nonfarm payrolls out this Friday. The above graph show there hasn’t been much variance between the ADP and BLS government reports. If Friday’s BLS report is similar, it is more good news for the recovery.

“The labor market recovery continued to power through its challenges last month,” said Nela Richardson, chief economist, ADP. “November’s job gains bring the three-month average to 543,000 monthly jobs added, a modest uptick from the job pace earlier this year. Job gains have eclipsed 15 million since the recovery began, though 5 million jobs short of pre-pandemic levels. Service providers, which are more vulnerable to the pandemic, have dominated job gains this year. It’s too early to tell if the Omicron variant could potentially slow the jobs recovery in coming months.”

All-in-all, contrary to the pundits that are predicting another downturn because of rising inflation (or the latest Omicron variant), more American workers are returning to work, either as employees or self-employed.

And supply chains are easing, according to various reports, with anchored shipping waiting to offload to the LA and Long Beach ports down more than 20 percent in just the last week, according to the White House, which will ease supply-chain and inflation worries as well.

Harlan Green © 2021

Follow Harlan Green on Twitter: https://twitter.com/HarlanGreen
Posted in Consumers, COVID-19, Economy, Weekly Financial News | Leave a comment

Does America Care Again?

Financial FAQs

PEW Research

The American Rescue Plan, The Infrastructure Investment and Jobs Act, and the soon to pass Build Back Better Plan show that the American ‘can do’ spirit is alive, the innate generosity and optimism that is so much a part of the American spirit is returning.

Will a revival of that spirit last, in spite of the ongoing pandemic, red vs. blue state civil war, and still record joblessness?

The truest expressions of Americans’ character have come out during past catastrophes, such as the Great Depression and World War Two. And almost 10 years of unparalleled growth followed the horrors of World War One and the 1918 Spanish Flu pandemic. 

The coronavirus pandemic is bringing about a similar transformation of character and culture that was always there but sometimes hidden when times were good.

Record economic growth is also following this pandemic; with Q1 and Q2 2021 GDP up more than 6 percent, and the fourth quarter possibly growing at the same pace after the third quarter pause due to the Delta variant surge.

Americans are showing that they care for each other with these bills—that lifting children and the poorest out of poverty also lifts themselves. That renewing our roads, bridges, energy grids, and confronting the greatest threat to our future, climate change, will ensure a country that our children can be proud of and prosper in.

It’s obvious that the American Rescue Plan saved many lives and livelihoods, and the Infrastructure bill means caring for the planet as well as each other with its $billions spent on climate change and improving health and sanitation.

It’s less obvious what spending on social infrastructure does. Investing in children, improved healthcare, and paid family leave strengthens families, something both political parties should be for, but conservatives have opposed since FDR’s New Deal.

Who will get most of the good jobs in construction from rebuilding our physical infrastructure? Some 80 percent go to less-then-college-educated workers, says the White House in its initial announcement of the Infrastructure Investment and Jobs Act.

In part because of the recovery money already distributed during the pandemic, median household income has resumed its climb for the first time since 2000, as shown in the above PEW research graph. It had dropped from $70,800 in 2000 to $65,100 after the Great Recession.

In 2018, the median income of U.S. households stood at $74,600. This was 49 percent higher than its level in 1970, when the median income was $50,200. (Incomes are expressed in 2018 dollars.)

The pandemic is bringing about a whole transformation of America that will last because it is bringing Americans together again in common cause, and history shows this brings out the best in us.

Harlan Green © 2021

Follow Harlan Green on Twitter: https://twitter.com/HarlanGreen
Posted in Consumers, COVID-19, Economy, Keynesian economics, Politics, Weekly Financial News | Leave a comment

Why are So Many Quitting?

Popular Economics Weekly

Calculated Risk

Several headlines last Friday screamed 4.4 Million Workers Quit Their Jobs, as if that was the most important takeaway from the Labor Department’s October JOLTS report.

But there were also 6.5 million hires (dark blue line in graph) and 10.4 million separations (yellow line).

In fact, many of those quitting were shifting to better jobs, not leaving the workforce. Quits were up 34 percent year-over-year to a new record high. These are voluntary separations that generally mean they are finding better jobs. (see light blue columns for “quits”).

Another indication job formation is heading in the right direction is that 4th Quarter GDP growth predictions are between 6 to 8 percent, up from the Q3 growth slowdown to 2 percent, due largely to the expectation that Delta infection rates are falling.

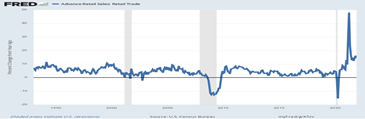
This is huge and predicates many more job hires as producers race to stock their shelves in the face of shortages. They had better stock up soon, as consumers are buying like never before. Retail and trade sales surged 1.7 percent last month, the government said today, and are up 16.3 percent YoY.

That’s the biggest gain since the government last doled out billions of dollars in stimulus money to families with the American Rescue Plan in March that kept many families and businesses solvent. It delivered $1400 to millions of American families, extended enhanced unemployment benefits and boosted funding to ramp up vaccine distribution and reopen schools.

Retail sales rose 4 percent last month at internet retailers, 3.8 percent at electronics and appliance stores and 2.2 percent at department stores to lead the way in October, all strong numbers. Sales also climbed 1.8 percent at auto dealers, but partly because of record prices. Automakers can’t make enough cars to satisfy demand due to a global parts shortage. Gas prices also surged 3.9 percent last month because of higher oil prices.

If autos and gas are set aside, U.S. retail sales rose a smaller 1.4 percent last month. Those two categories often exaggerate ups and downs in consumer spending and aren’t always good indicators of how much households are willing to spend.

Nor is it a reliable indicator of inflation, as retail sales are not inflation-adjusted. Consumers are pushing up prices because they have so much money to spend, and the supply bottlenecks won’t subside until next year; after the holidays when consumers traditionally become stingier.

So now isn’t the time to fret about inflation.

CDCCovidTracker

Another pandemic surge is much more worrisome, as infection rates are declining more slowly at the start of cold weather when Americans go indoors, which is a real reason to worry about what may happen next year.

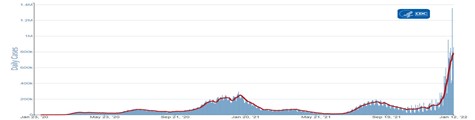
“The current 7-day moving average of daily new cases (70,431) decreased 1.4% compared with the previous 7-day moving average (71,450). A total of 46,180,190 COVID-19 cases have been reported as of November 3, 2021.”

So the best holiday wish for this week is that we all stay as healthy and wealthy as possible!

Harlan Green © 2021

Follow Harlan Green on Twitter: https://twitter.com/HarlanGreen
Posted in Consumers, COVID-19, Economy, housing market, Weekly Financial News | Leave a comment