Existing-home sales of single-family, condos and apartments were down slightly from their recent highs for a number of reasons. This is while demand for housing is skyrocketing with home prices up 20 percent year-over-year, but there just isn’t enough inventory, especially at the low, affordable end where young adults can buy a home or condominium, and builders are scrambling to catch up.
The Calculated Risk graph shows that last year during the pandemic existing-home sales reached the highest sales rate since 2006 and the pre-Great Recession housing bubble. So the worry is how to fulfill the exploding housing needs of Americans after the pandemic has caused a record number of homeless and at least 10 million homeowners behind on their mortgage payments.
The National Association of Realtors reported in May:
“Total existing-home sales,1https://www.nar.realtor/existing-home-sales, completed transactions that include single-family homes, townhomes, condominiums and co-ops, dropped 0.9% from April to a seasonally-adjusted annual rate of 5.80 million in May. Sales in total climbed year-over-year, up 44.6% from a year ago (4.01 million in May 2020).
“Home sales fell moderately in May and are now approaching pre-pandemic activity,” said Lawrence Yun, NAR’s chief economist. “Lack of inventory continues to be the overwhelming factor holding back home sales, but falling affordability is simply squeezing some first-time buyers out of the market.”
So how will we provide enough homes to fill the rising demand for housing—not only to house those that can afford to buy, or rent, but for the homeless?
Housing economists predict that partly due to the pandemic, America is short some 5 million housing units, including rental housing.
Forbes Magazine summarizes a compendium of reports from WSJ and others that there would be 5.5 million more housing units today, if as many were built since 2000 as were built for baby boomers from 1968 to 2000.
“To make up the shortage, the NAR report says the U.S. would have to build 2.1 million homes each year for a decade—more than it built each year during the housing boom of the mid-2000s,” says Forbes.
That could be a problem with last month’s residential housing starts increasing 3.6 percent in May to a seasonally adjusted annual rate of (just) 1.57 million units off a downwardly revised April reading, according to a report from the U.S. Department of Housing and Urban Development and the U.S. Census Bureau.
This is third highest, per the St. Louis Fed’s single-family starts since 1960, which shows the record for starts was 1.8 million in January 2006 at the beginning of the housing bubble, and the last time interest rates were lower than the inflation rate, as they are today with the Fed’s various quantitative easing purchases of treasury bonds and mortgage-backed securities.
The May reading of 1.57 million starts is the number of housing units builders would begin if development kept this pace for the next 12 months, says the National Association of Home Builders. Within this overall number, single-family starts increased 4.2 percent to a 1.10 million seasonally adjusted annual rate. The multifamily sector, which includes apartment buildings and condos, increased 2.4 percent to a 474,000 pace.
So how can we increase production? “[W]e’ll need to do something dramatic to close this gap,” said Yun in a press release. The association proposed increasing the housing supply by creating or expanding tax credits, loans or grants for builders who renovate or build new housing in low-income areas and who convert old malls and factories into homes. They also asked for incentives for cities to allow denser zoning, an approach that President Biden included in his infrastructure proposal, Reuters reported.
The White says the President’s infrastructure plan proposal invests $213 billion “to produce, preserve, and retrofit more than two million affordable and sustainable places to live. It pairs this investment with an innovative new approach to eliminate state and local exclusionary zoning laws, which drive up the cost of construction and keep families from moving to neighborhoods with more opportunities for them and their kids.”
So it’s now up to the Senate to reach a final agreement on the bill, which will determine if we can even begin to cure the housing shortage.
The financial markets were shocked, yes shocked, when the May Consumer Price Index for retail prices jumped 4.9 percent year-over-year. Just kidding. No one was really surprised because one year ago it wasn’t rising at all (well, just 0.22 percent). It was predicted to rise substantially with the $4 trillion plus in government aid already being injected into companies and individuals.
Inflation has averaged around two percent since the 1990s, per the above St. Louis Fed graph that dates back to 1950, so everyone business economist should know that it would eventually trend back to the historical average, given the just-in-time worldwide supply chain that has tamed prices.
In fact, CPI inflation was rising as high as 5.5 percent annually in July 2008 during the Great Recession, before another jaw-dropping plunge to -0.32 percent in 2009. You get the drift. So who is worrying about these temporary ‘blips’ in inflation? The financial markets, of course.
They love to use other peoples’ (borrowed) money to finance their stock, bond and commodity market transactions, if possible. And interest rates have been at rock bottom over the past year; close to zero for short-term rates, and the 10-year benchmark treasury yield below one percent for much of the time. It is still in a daily trading range of 1.5-1.6 percent, per the below FRED graph.
This is one reason market indexes have been at record highs, and why they gyrate so wildly on almost a daily basis as traders try to guess what the Fed will do next in its almost daily pronouncements on when they might allow short-term interest rates to rise.
Consumers don’t have to worry so much, because it has been extremely difficult for the Federal Reserve, or anyone else, to keep CPI inflation above two percent, especially during this once in a 100-year coronavirus pandemic. Inflation below that range has invariably meant there is too little aggregate demand—consumers aren’t buying, investors aren’t investing, and banks aren’t lending.
CEPR’s Dean Baker just remarked on what has boosted inflation of late. It’s gasoline prices and insurance rates spiking because of the sudden surge in travel, as consumer bust out of their prolonged at home hibernation.
“Overall, the story this month is overwhelmingly that bounce back inflation was 100 percent predictable, coupled with soaring car prices (both new and used) due to temporary shortages. There’s not much here to get excited about,” he said.
“The overall CPI was up 0.6 percent (monthly), the core rose 0.7 percent. New and used cars were major factors, rising 1.6 percent and 7.3 percent, respectively. The jump in used and new car prices added 0.3 percentage points to the inflation rate for the month.”
And, he continues:
· Even though it’s hard to get good help, restaurant prices outpaced food prices by just 0.1 percentage points over the last three months, 1.0 percent to 0.9 percent.
· The medical care index fell 0.1 percent in May, up just 0.9 percent over last year. Drug prices were flat, down 1.9 percent over last year.
· Rent indexes: rent proper increase just 0.2 percent; owner equivalent rent rose 0.3 percent in May.
· Apparel prices jumped 1.2 percent in May, car insurance 0.7 percent, and air fares 7.0 percent. The indexes are respectively 2.2 percent, 0.2 percent, and 6.3 percent below the February 2020 level.
It is also why the housing market is booming. Interest rates are this low because bond traders see very little danger of longer-term inflation, and the Fed promising to hold short-term rates close to zero for at least one more year.
When will most American workers return to work, and the U.S. economy return to normal activity? The Calculated Risk-FRED graph since 1992 tells us that retail sales have historically never varied substantially from a 5 percent annual increase, except during the blue bar recession periods indicated in the graph, and consumers and businesses have spent most of their pandemic aid. It could take another year.
The U.S. Census Bureau reported “Advance estimates of U.S. retail and food services sales for May 2021, adjusted for seasonal variation and holiday and trading-day differences, but not for price changes, were $620.2 billion, a decrease of 1.3% from the previous month, but 28.1% above May 2020.”
Altogether, the number of people reportedly still receiving benefits from eight separate state and federal programs totaled 14.8 million as of May 29, reports MarketWatch’s Greg Robb. It is down about 560,000 from the prior week. Last year, 30 million Americans were receiving these extra benefits, while the historical range receiving claims is in the mid-200,000s, so one can see why it might take another year for economic activity to return to normal.
Retail sales began to rebound last April with the first aid checks, and really took off this January with the additional recovery dollars going to individuals. Clothing and accessory sales are up 200 percent from May 2020, while food service and drinking places surged 71 percent and electronic and appliance stores gained 91 percent.
This sudden prosperity is creating many bottlenecks, raising all prices and shrinking the housing supply, with builders struggling to meet the increased demand.
Privately‐owned housing starts in May were at a seasonally adjusted annual rate of 1,572,000. This is 50.3 percent above the May 2020 rate of 1,046,000, but is not enough construction to satisfy the soaring demand for more housing—new or used.
NAR chief economist Lawrence Yun commented on the May starts: “Despite the month-to-month trend, or even year-to-year changes, America is facing a massive housing shortage due to multiple years of underproduction in relation to population growth. We estimate around 5.5 to 6.8 million additional housing units need to be built. America is on track for only 1.6 million and 1.7 million new housing units this year and next, respectively. That would represent the best two-year performance in 15 years, yet it would still be inadequate. Therefore, expect both rents and home prices to outpace overall consumer price inflation in the upcoming years.”
Calculated Risk
Where is this housing supply to come from? Estimates of population growth, demographic change, and demolitions suggest about 1.3 million households will form annually for the next few years, Goldman Sachs analysts said in a May note cited by Business Insider.
“Millennials are just reaching peak homebuying age and set to keep demand strong for the foreseeable future. Elevated lumber prices and lot shortages will continue to drag on construction even as starts accelerate. And while mortgage rates have risen from their pandemic-era floor, they still sit at historically low levels and should keep demand robust, the bank said.”
In 2021, the Mortgage Bankers Association (MBA) forecasts single-family housing starts to be around 1.134 million. And that could just be the beginning, as projections going forward are even rosier: 1.165 million single-family homes in 2022 and 1.210 million in 2023.
And we should see more entry-level homes under construction in 2021, says Joel Kan, associate vice president economic and industry forecasting at the MBA. That could help a potential pinch point, as too many entry-level buyers are helping to push up prices, making those homes unaffordable for that very group.
“We’ll see more affordable homes come onto the market as builders try to meet demand for these homes,” Kan says.
“Some 5.16 million people who have exhausted state compensation were also getting extra $300 a week in federal benefits as of May 29, down about 75,000 from the prior week,” says Robb. “The federal program ends in September and more than two dozen states are going to end the program early starting in the middle of this month.”
We know that will slow down the return to normal growth in those 25 states that are coercing their lower-paid workers to return to jobs they might not like. And that is on top of the need to find adequate housing.
The number of job openings reached a series high of 9.3 million on the last business day of April, the U.S. Bureau of Labor Statistics reported last Tuesday. Hires were little changed at 6.1 million. Total separations increased to 5.8 million. Within separations, the quits rate reached a series high of 2.7 percent while the layoffs and discharges rate decreased to a series low of 1.0 percent.
American workers are finally in a position to pick and choose from what is a record number of job openings. As proof, the number of quits jumped to a new all-time high of 4.0 million, versus 3.6 million last month. These are voluntary exits from one job to a presumably better job.
This is panicking 25 states with Republican governors into terminating the additional $300 per week in unemployment benefits early, believe it or not. They seem to be afraid that their workers might take the time to shop for a job with better pay and benefits, which is what anecdotal evidence is already showing.
The blue line in Calculated Risk’s graph tells us that hirings have actually returned to a more normal level, but sudden opening of the economy has orders pouring in for goods and services, which is more demand that can be satisfied at the moment, and this is boosting workers’ wages.
Reuters said “Higher worker mobility undoubtedly contributed to the surge in hourly earnings in the past two employment reports, as employers must not only pay higher wages to attract new workers but may feel more pressure to raise compensation to retain their existing employees.”
There are still too many unvaccinated employees that don’t feel safe returning to work, and most schools are still out or having only partial re-openings for many women to return to work.
Treasury Secretary Janet Yellen also claimed data does not support the argument that increased unemployment benefits are leading to a workforce shortage. She said when they looked at states and sectors where supplemental benefits were high, there weren’t lower job finding rates as the argument would suggest, and in fact it was the “exact opposite.”
The simple truth is that Republican governors en masse that suppress additional aid for their workers is in keeping with their small government principles. Why else give up $26 billion that will flow to them if they allow their workers to keep the additional benefits?
Sadly, research is showing that this hurts those states, report a number of researchers. A report cited by The Center For Equitable Growth, for example, concludes that workers salaries increased as much as five percent when their unemployment benefits were extended to 99 weeks in 2010-11 following the Great Recession.
And as of May’s jobs report released last Friday, the country is still down 7.6 million jobs from before the pandemic, reports The Hill. The May jobs report also indicated that there are 9.3 million people who are officially unemployed — meaning they are actively looking for work and unable to find it. In most industries, the number of jobseekers still exceeds the number of job openings.
We are in a different world with COVID-19 that is killing more than all the world wars, in other words, a time like the Great Depression and New Deal when small government ideology makes no sense.
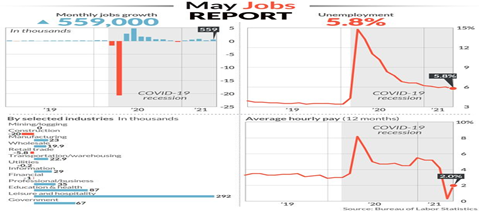
This would be a good jobs report at any other time. Total nonfarm payroll employment rose by 559,000 in May, from a revised 278,000 jobs in May, and the unemployment rate declined by 0.3 percentage point to 5.8 percent, the U.S. Bureau of Labor Statistics reported today. Notable job gains occurred in leisure and hospitality, in public and private education, and in health care and social assistance.
Employers are crying labor shortage because they were surprised by the sudden 6.4 percent Q1 GDP growth pickup, so they were hoping for more new jobs in the May report. But maybe there is another reason for some workers not taking new jobs as quickly as employers would like—the businesses that employed them may be permanently closed, hence the large number still receiving unemployment benefits.
WSJ reported that the pandemic resulted in the permanent closure of roughly 200,000 U.S. establishments above historical levels during the first year of the viral outbreak, according to a study released Thursday by economists at the Fed. In recent years, about 600,000 establishments have permanently closed per year, or about 8.5 percent, according to the study, so the total number could be upwards of 800,000 businesses permanently closed during the first pandemic year.
Then why would those losing their permanent jobs, permanently, want to return to work quickly? Why shouldn’t they be given time to get over their loss? Have sociologists and psychologists even studied such traumas in detail?
We know something about the hurt from permanent job losses in the Rust Belt—soaring drug use and suicide rates in studies by Nobel laureate Angus Deaton and Anne Case.
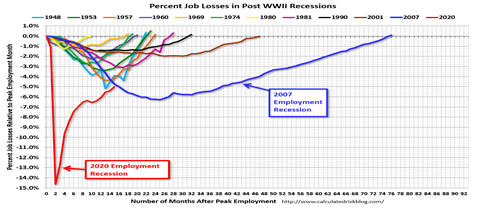
The Federal Reserve gives a preliminary estimate of jobs permanently lost, and as of May it was 3.234 million from 3.529 million permanently lost in April. The calculated Risk graph shows the percentage losses in all post-WWII recessions, and the time it took to return to normal levels, 5 years in 2001 (light blue line), 8 years in 2007 Great Recession (dark blue line) and 15 months in pandemic (red line).
Individual companies account for about two-thirds—or roughly 130,000—of the extra business closures if historical patterns hold, according to the Fed economists who examined businesses with employees, cited by WSJ. Other closed establishments are units of major companies—say, a Gap or Pizza Hut—that closed some locations while remaining in businesses.
The service sector was hardest hit and is roaring back with 292,000 jobs in Leisure and hospital, followed by Education and health, and government. More women will return to the workforce, particularly mothers when schools are fully open in the fall. Other service-oriented businesses such as hotels, museums, parks and entertainment venues also added a flush of new jobs.
MarketWatch’s Jeffry Bartash reports the global tally for the coronavirus-borne illness climbed above 172 million on Friday, while the death toll rose to 3.7 million, according to data aggregated by Johns Hopkins University. The U.S. remained in the lead globally in cases with 33.3 million and deaths with 596,434, JHUniv data show, but the seven-day average for cases has fallen 48 percent from two weeks ago, according to a New York Times tracker, for deaths has dropped 28 percent and for hospitalizations has declined 22 percent as vaccinations continue to increase.
This all points to labor participation rates continuing to rise in the fall, though it depends in part on those workers that lost permanent jobs working through the debilitating effects of their losses.
Who is willing to help them, other than the Biden administration that is extending jobless benefits through September, and the 25 states that have not cut off their benefits too early.
Canyon Country Zephyr Magazine by stiles • May 31, 2021 • 0 Comments
I was an engineering student at UC Berkeley in the early 1960s. The student body was much smaller and campus quieter before free speech and Vietnam came along. There was no admission charge for California residents, just a $150 admin fee per semester before Ronald Reagan became Governor of California and decided students could afford to pay tuition if we had the time to take to the streets and protest our lack of free speech or a Vietnam war.
I had heard of Phil Pennington, a graduate student in the UC Mining School, next door to the Engineering School who was always leading nature trips to faraway places in the Sierra Nevada Mountains and beyond.
The UC Hiking Club was a fun place to meet people who love the outdoors as I did and Phil was really an evangelist for exploring the lesser known or unknown places, whenever there was a study break or vacation. God, I remember our climb of Mt. Shasta in the midwinter break that first year, 14,532 feet high, the second-highest peak in California. It took three days with snowshoes, then crampons and ice picks to climb the 45-degree slope of Avalanche Gulch to reach its top.
Cathedral in the Desert Before Lake Powell
And now Phil was preaching another tempting exploration, a remote canyon that very few knew about on the Colorado River in Utah. It was about to disappear behind a dam in 1963, so he was organizing trips to photograph and memorialize it before it was submerged under a large reservoir that became Lake Powell. We were mostly UC Berkeley students that had signed on wanting to see and explore new environments, and maybe help to save them.
It was an all-night drive from Berkeley just to arrive at the end of the paved road in the small town of Escalante, Utah, where we transferred into jeeps to reach the river at a place called Hole in the Rock, so named by the Mormons who blasted a passage in the canyon wall at that point to cross the Colorado and settle more of Utah in the 1800s.
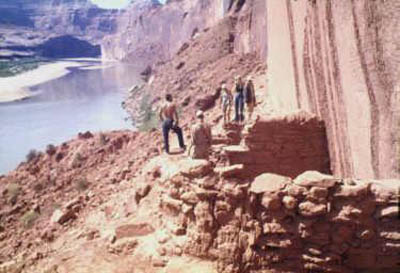
This was the Glen Canyon later made famous by The Place No One Knew, a Sierra Club book and film. Eliot Porter was the photographer and filmmaker who gave public recognition to this canyon the Colorado River had carved into magnificent formations north of the Grand Canyon. But it didn’t have the spectacular views of the Grand Canyon 100 miles to the south, though its sheer cliffs soared as high as 2,000 feet and been inhabited by native-Americans since at least 1,000 AD. We learned much of its history from archeologists we encountered along the way who were preserving what they could from the ancient cliffside ruins.
I remember we bounced across the Kaiparowits Plateau with our equipment—either kayaks, or inflatable rafts, and even a German-made Fold Boat to take us down approximately 100 miles of the Colorado to the brand-new Page Dam that was beginning to form Lake Powell.
The first trip during UC’s Christmas break was the most unforgettable. By the time dawn was breaking over the eastern sky we were exhausted from the all night ride after another 62 miles of sand track from Escalante,. That’s what wilderness can do in taking one out of usual experiences and a sleepless night.
Suddenly, a line of crucified bodies on high poles with their hair waving in a slight breeze appeared in the eastern dawn sky along the dirt road we were traveling.
That stopped us in our tracks. What were we looking at? Bleary-eyed from the drive, none had the slightest idea. Spartacus had just been released, which portrayed the conquered rebel slaves crucified on crosses in a line that stretched to the horizon, but it was another matter to see such a line right in front of me rather than on a movie screen. It took some time before we saw they were not real bodies despite the waving hair from a slight breeze, but a incredibly realistic rendition of crucifixions strung out on evenly spaced poles for at least one-quarter of a mile.
Then we came upon the walls of a towering, castle-like façade which had to be the front of a walled city with another crucified figure on a cross leaning against the wall with a tin can in hand, as if for donations. I can remember the eerie feeling of what was beginning to look like a movie set in the most-out-of-the-way place imaginable. It could be of an ancient world, or the future world of science-fiction. We next encountered a small, deserted, white-domed village before descending to the shore of the Colorado River where several pine trees upon close examination sat silently on their artificial bases. We now knew this had to be a movie set, but for which movie?
And what was this doing in the middle of a pristine wilderness, accessible only by jeeps or four-wheelers? We were mostly disappointed that it no longer seemed so pristine, in a word.
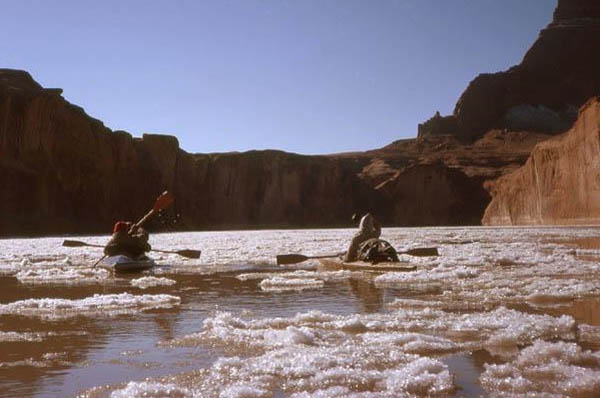
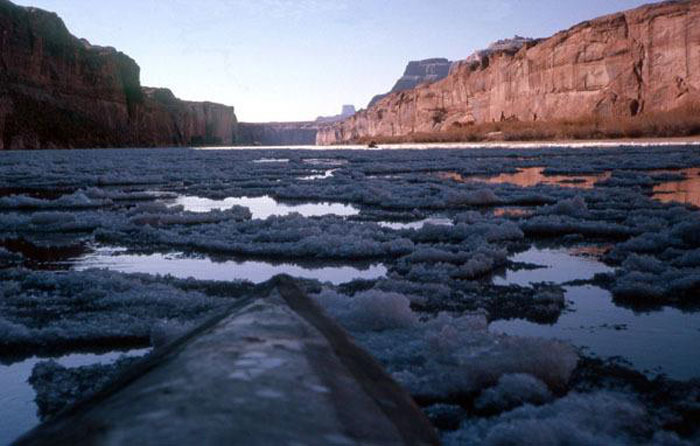
First Christmas in Glen Canyon with ice floes
It was also mid-winter. The weather has suddenly turned extremely cold over the Christmas holidays with snow on the ground and ice floes floating by us in the Colorado River. I hadn’t anticipated this, having just a one-person inflatable raft on our first trip that was continually punctured by the sharp-edged floes as we began paddling down the river. So I had to come to shore to patch it with every puncture. On one such break a couple of cowboys on horseback watching our tribulations rode over to talk. They said they were movie wranglers tending stock; horses, goats and sheep that had been penned further up in the canyon rocks.
It turned out we had come upon the set of The Greatest Story Ever Told, George Stevens’ epic of Christ with Max Von Sydow as Christ, and Charleston Heston as John the Baptist. But they had stopped filming for a couple of weeks because it had snowed. Director Stevens did not want snow in Bethlehem, they said, which was the white-domed village encountered, or on the banks of the Colorado, a substitute for the Jordan River where John the Baptist baptized Christ. And that was just the beginning of our journey.
It was obvious Director Stevens wanted to tell the “Greatest Story Ever Told” in one of nature’s greatest settings that most Americans would never be able to visit in person. This area of Utah and Colorado is a magnificent tapestry of mountains that loom over hollowed out canyons containing wilderness areas such as Canyonlands National Park and Arches National Monument. The Arches contain more than 2,000 sandstone arches that span hundreds of feet. Another wilderness area, Dinosaur National Monument, named after the more than 800 paleontological sites containing dozens of dinosaur species on the Green and Yampa Rivers that run into the Colorado above Glen Canyon.
The cowboys told us many stories as we huddled together. It was dawn and freezing cold. So they would kick in one mesquite bush after another and light them, which we huddled around to keep warm. They had been stock wranglers for many other movies, they said, such as The Soldiers Three with Dean Martin and Frank Sinatra and led trips for movie stars such as Clark Gable, who hunted cougars that roamed the Kaiparowits Plateau during those times and were considered predators to be eliminated by the ranchers.
This was an example of what most Americans would never see in person—except in movies such as George Stevens’ epic The Greatest Story Ever Told.
Christmas 1961 freeze
The unreality of a biblical movie set reinforced our resolve to preserve as much of the real canyon as we could with pictures. Glen Canyon had brilliant, multi-colored cliffs and hollowed out sandstone formations that led into tributaries and labyrinths too numerous to count, and the plateau that loomed above it. It was also home to the Moqui and Anasazi Indians that lived in cliff dwellings centuries earlier, impossibly perched in almost inaccessible caverns and ledges high up the walls of the canyon.
Their ancient dwellings were tucked into pockets that were accessible only by very narrow footpaths in some places to protect them from marauders; some walls so sheer that ladders were needed to access them. All this was being inundated by Lake Powell, named for John Wesley Powell, a one-armed American Civil War veteran who in 1869 was the first non-native American to lead a party that traversed the Colorado River in three wooden boats.
Second Spring trip on closing of Lake Powell
By the second trip in February 1963, the word was out. The Page Dam had closed, and its reservoir began to fill as we approached it. Now all manner of preservationists; including anthropologists, botanists, and archeologists were clambering over cliffs photographing and collecting what artifacts they could find as we floated down the rising river that no longer had ice floes, among beavers and other wildlife looking for new homes. We also saw Navajo sheepherders with their sheep on the eastern side of the river which bordered the Navajo Reservation.
Inspecting cliffside dwellings on April 1963 trip as waters rose
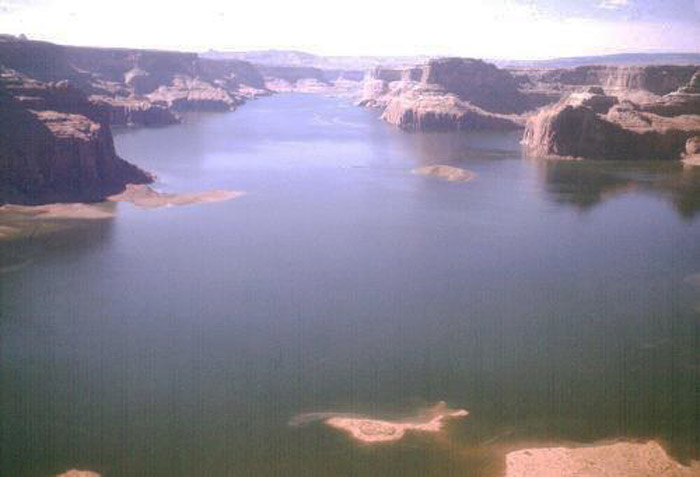
Glen Canyon had no difficult rapids and mile-high cliffs compared to the Grand Canyon, so it wasn’t spared a dam to power the lights and air conditioning of Arizonans. The Colorado River would fill Lake Powell; therefore becoming accessible to all with motor homes and motor boats to roar up and down its length in what became the Glen Canyon National Recreation Area.
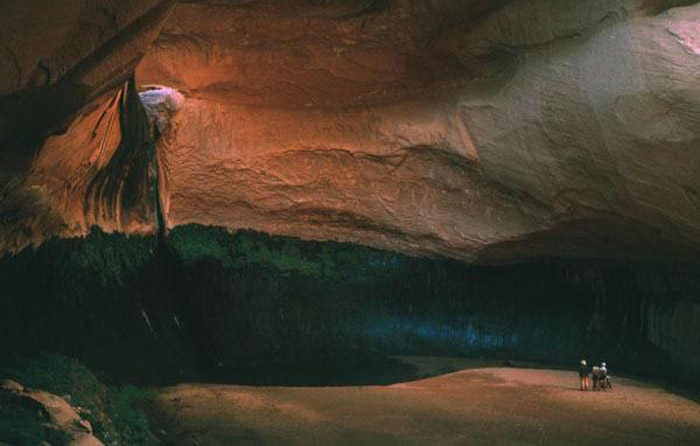
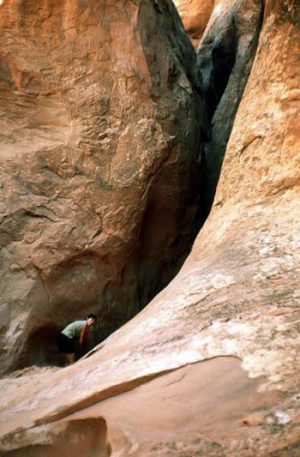
We were seeing a rare and beautiful canyon being inundated to create a recreational lake for the many and provide more electricity for a growing Arizona. I still remember the side canyons in shades of orange and purple, such as Labyrinth Canyon where the sun barely penetrated. It narrowed to two feet in places; just wide enough to squeeze through. And Cathedral in the Desert with its soaring spires on walls that arched overhead to create a sacred place. Under the bluest of skies, we were surrounded by a silence broken only by the rippling, flowing sound of a placid stretch of the Colorado River.
In January 2003, forty years after Page Dam closed, David Brower, former Executive Director of the Sierra Club wrote in the Sierra Club Magazine that he regretted the Sierra Club’s decision to agree to the Page Dam project, because it turned out to be an unnecessary dam. It was one of many dams built at the time that lost their reason for being.
He had thought at the time that it would be a way to prevent more dams being built on the Colorado and help to preserve the Grand Canyon, as well as serve as a basin to slow down the silting of Hoover Dam’s Lake Mead further downstream. Most of the Grand Canyon is made up of sandstone formations that erode into the river during spring melts transporting enormous amounts of silt.
Why did Page Dam turn out to be unnecessary? Studies Brower cited maintained it robbed water from Lake Mead and Hoover Dam that actually reduced its amount of generated power. “Except for a minor diversion at Page, Arizona, and the 30,000 acre-feet delivered annually to the nearby coal-fired power plant, all the water not lost to evaporation or leaks is diverted to users downstream at Lake Mead and below,” said Brower in the Sierra Club article. “Lake Mead’s Hoover Dam can control the Colorado River without Lake Powell and can produce more power if Powell’s water is stored behind it saving massive amounts of money, water, and wild habitat. Economics and ecology are ready to team up on this one.”
“Glen Canyon died, and I was partly responsible for its needless death,” wrote Brower in The Place No One Knew, Eliot Porter’s Sierra Club book first published in 1963. “Neither you nor I, nor anyone else, knew it well enough to insist that at all costs it should endure. When we began to find out it was too late.”
Cathedral in the Desert in April
The Glen Canyon Institute was formed in 1996 to advocate restoration of Glen Canyon. It is also part of a growing river restoration movement to remove other unnecessary dams that is gaining increasing popularity with the public. More than 460 dams have been removed in the past 40 years in the U.S. at this writing.
It says on its website, www.glencanyon.org, “At the heart of the River Restoration Movement is Glen Canyon Dam and the movement to restore a healthy Colorado River. The loss of Glen Canyon was a turning point in the birth of the modern Environmental Movement and has been mourned since the dam’s construction. As the symbolic heart of the movement today, the movement to restore Glen Canyon represents our society’s realization of the value of free-flowing rivers and complex ecosystems that depend upon them. Glen Canyon, which was hailed by many as one of the most beautiful places on earth, was lost to the thoughtless era of dam building.”
That was why Glen Canyon became The Place No One Knew that I and a few others were privileged to see for maybe the last time in its pristine form. There was something about those trips, and the Berkeley activists such as Phil Pennington, an early environmentalist that inspired many of us to want to protect our environment.
Labyrinth Canyon
“Whatever the final details of Lake Powell’s water losses turn out to be, the draining of the lake simply has to happen,” wrote Brower. “The river and the regions dependent upon it, including Baja California and the Gulf of California, can no longer afford the unconscionable loss of water. We need to get rid immediately of the illusion that the only way to protect water rights is by wasting water in Lake Powell. We can simply let the flow reach Lee’s Ferry, Arizona (the dividing point between the Upper and Lower basins), naturally, beautifully, and powered by gravity at no cost.”
There is no more important fight to save our planet from the further loss of such beautiful and inspiring places as Glen Canyon. And efforts by The Sierra Club and others are now in motion to restore it, if the U.S. Reclamation Bureau can be convinced that it is no longer necessary. The tide has turned on the need for more hydroelectric power; as alternative forms of energy such as wind and solar power replace ecologically damaging hydroelectric projects.
David Brower gives credit to other conservation organizations that support restoration of Glen Canyon, such as the National Parks Association, the National Wildlife Federation, and The Izaak Walton League, but it will take decades to restore Glen Canyon even after Lake Powell is drained. And today The Glen Canyon Institute has been formed that is “Dedicated to the restoration of Glen Canyon and a free-flowing Colorado River.”
I even dare to say that these experiences outside of a classroom were as educationally enriching as a formal education at UC Berkeley, or any institution, and open to those curious about and wanting to explore the incredible variety of life that surrounds us.
I later joined the U.S. Environmental Protection Agency in 1970, the year the EPA was formed to protect as much as we could of our environment. This was in large part because of my initial, unforgettable experience in The Place No One Knew. And participating in the effort to preserve and maybe restore it is our contribution to preserving what we can of nature’s beauty, which is truly The Greatest Story Ever Told.
The sad ending of our trips
Harlan Green lives in Santa Barbara, CA. He is a banker and Mortgage Broker, with degrees in Economics from UC Berkeley and Film/Broadcasting from Boston University. He has written financial columns and articles for west coast newspapers and periodicals, and conducted financial seminars for more than 20 years.
President Biden’s $6 billion 2021-22 budget proposal would rebuild America’s infrastructure and social safety net, supporting those essential workers that need it the most.
“It also represents the most substantial expansion of the federal government’s spending powers since World War II and a direct rebuttal of the small-government principles of his Republican, and even many Democratic, predecessors,” reports VOX.
Then why are 24 states terminating the additional $300 per month payments early that Biden’s $1.9 billion American Rescue Plan has extended until September, reports NY Times Binyamin Appelbaum?
The simple truth is that red states are suppressing any additional aid for their workers as much as possible in keeping with their small government principles. Why else give up $26 billion that will flow to them if they allow their workers to keep the additional benefits?
It is also a sign that Republicans will oppose President Biden’s new budget, which is really his ‘new’ New Deal that scares the daylights out of conservatives because it will show that government can work for all Americans, not just the wealthiest as it has over the past 40 years.
Biden’s budget proposal includes the a $2 trillion American Jobs Plan — which would embrace an expansive definition of infrastructure, not only to modernize America’s road and bridges, but to invest in broadband and elder care — and a $1.8 trillion American Families Plan, which would establish free higher education and expand child care, health care, and tax benefits for needy families.
“As proposed, the budget would reinvest in infrastructure and education, raise taxes on the wealthy and corporations, and meet many — but not all — of Biden’s campaign promises,” says VOX.
This is while the Atlanta Fed has just updated their second quarter growth prediction:
“The GDPNow model estimate for real GDP growth (seasonally adjusted annual rate) in the second quarter of 2021 is 10.3 percent on June 1, up from 9.3 percent on May 28. After this morning’s Manufacturing ISM Report On Business from the Institute for Supply Management and the construction spending report from the U.S. Census Bureau, the nowcasts of second-quarter real personal consumption expenditures growth and second-quarter real gross private domestic investment growth increased from 8.6 percent and 20.7 percent, respectively, to 9.5 percent and 22.0 percent, respectively,” said the Atlanta Fed.
Goldman Sachs estimates 9.5 percent Q2 GDP growth while the New York Fed posts a much more conservative 4.5 percent spurt.
In fact, manufacturing activity is surging with the Institute for Supply Management reporting that The May Manufacturing PMI® registered 61.2 percent, an increase of 0.5 percentage point from the April reading of 60.7 percent. This figure indicates expansion in the overall economy for the 12th month in a row after contraction in April 2020.
President Biden’s budget, if enacted, would give a boost to GDP growth for the rest of this year because it targets working people that generate most economic activity, including essential workers that provide health care, police and fire protection, because they spend the largest percentage of their incomes.
And that is just a few of its elements, says VOX. “It also proposes universal pre-K, affordable childcare, and paid leave. It also puts the climate crisis front and center, with proposals dedicated to reducing US emissions, creating jobs in the clean energy sector, and funding climate research.”
Focusing on those folks that most need the support, this budget will boost what economists maintain will give the biggest boost to economic growth. The Federal Budget has supported the wrong segments of society for too long by cutting taxes and social services, when just the opposite is needed to end this coronavirus pandemic and be ready for whatever comes next that could damage economic growth—maybe our changing climate, or another pandemic?
“In the week ending May 15, the advance figure for seasonally adjusted initial (jobless) claims was 444,000, a decrease of 34,000 from the previous week’s revised level. This is the lowest level for initial claims since March 14, 2020 when it was 256,000,” says the US Bureau of Economic Analysis.
Most of the decline came from a decrease in those getting benefits through pandemic-related emergency programs. States showing the largest declines included Georgia (-8,216), Kentucky (-7,175) and Texas (-4,828), according to unadjusted data. New Jersey showed the biggest gain, with 4,384.
Along with the steady slide in the headline number, the total of those receiving various government benefits tumbled by nearly 900,000 to just shy of 16 million, according to BEA data through May 1.
The high number still receiving benefits has caused some 23 states to back out of the $300 weekly federal bonus checks as soon as June, with Florida being the latest state to announce it is canceling extended federal unemployment benefits. That’ll cut off more than 3.6 million people from getting enhanced benefits related to the pandemic that Congress has authorized to expire in September..
State governors claim that this unemployment coverage discourages workers from taking jobs, citing labor shortages. Some economists and analysts disagree, noting that several factors are preventing people from finding suitable work, including lack of child care and fear of contracting COVID-19.
The 2 million person gap between Job Openings and actual Hires in the government’s latest JOLTS report is growing evidence that there is a red-hot demand for workers after what I call the pandemic recession, even with the high number out of work and still receiving benefits.
Why the record number of job openings at the same time so many are still receiving benefits? It will take time for workers to find suitable jobs, while employers need to raise their minimum wages for essential workers in the service sector (that are the lowest paid) to attract them back to work.
Service sector employers such as Amazon say they are raising their minimum wage to $15 per hour, while Bank of America is raising the minimum wage from $20 to $25 per hour for its clerical workers.
It is perhaps why a record number of small businesses said they could not fill open jobs in April, adding to a growing national controversy over whether extra unemployment benefits are keeping scores of people from re-entering the labor force.
Some 44 percent of small businesses reported job openings went unfilled, according to the National Federation of Independent Business. The NFIB is the nation’s largest small-business lobbying group.
It is less understandable why the red states are the first to terminate extra aid to their own lowest-paid workers before September, maintaining that it is keeping them from working in jobs that probably pay less than the weekly benefits (aid that is also free $$ to the states), as I said.
It not such a good idea because cutting off the additional benefits is exacerbating the income inequality that has been a major cause of record drug use and suicide rate among high school-educated white males that have lost formerly high-paying jobs in the rust belt.
It also tells us that red states governors, (such as Arkansas Governor Asa Hutchinson in a recent NPR interview), think little of the plight of Arkansas’ own essential workers that fill most of the lower-paying jobs after having weathered one year of pandemic hell.
The good news is that workers are now getting to pick and choose what jobs they would prefer. That is just one of the changes we are seeing as the 2020’s economy begins to roar.
There aren’t many economists that still debate the origins of our record income inequality, the worse in the developed world, and even in some of the developing world.
A loss of $10/hour in the typical worker’s compensation is the result of employers’ successful efforts to keep wage growth down over the past 40 years, according to a new paper by EPI distinguished fellow Larry Mishel and EPI director of research Josh Bivens.
Mishel and Bivens maintain that while productivity increased 69.6 percent from 1979-2018, employees’ compensation increased just 11.6 percent, per the EPI graph.
How did this happen? The obvious reasons are the growing strength of corporations and loss of labor union bargaining power that has allowed states to pass anti-labor laws and American corporations to ship many high-paying jobs overseas with little government regulation that would mitigate the job losses of domestic workers.
But it goes deeper. It goes back to the origins of the so-called economic sciences and the economic theories that politicians utilize to rationalize their policies.
They really derive from political economics, the original pseudo-science that attempted to understand human financial behavior, which is not that difficult to understand when we are talking about dollars and sense.
The owners of companies and the capital that controlled them wanted few regulations and lower taxes. So from 1980 onward Republican administrations and Big Business began to deregulation whole industries, and the labor laws and practices that guaranteed employees their fair share of the profits under what have been called Laissez Faire or free market economic theories.
Less government oversight and lower taxation, for instance, was based on the supposition that it encouraged greater growth, since corporations would create more jobs to produce more goods and services.
Industries have become more productive, but the increased profits were kept by the owners and chief executives of those companies rather than passed on to their employees; so much so that the gap has widened between employee’s hourly compensation and productivity to a level that doesn’t guarantee the majority of today’s service workers a living wage.
That justified lower trade barriers in turn, so that consumers with their reduced incomes could afford the cheaper goods now made made overseas.
Even the Supreme Court got into the act by allowing public employees to avoid paying any fees if they so choose, even though receiving all the benefits of union membership—higher wages, pensions, worker safety, the list goes on and on.
The Supreme Court issued a sweeping ruling in 2016 that dramatically undermined unions for teachers, firefighters, police officers, and other public employees throughout the United States.
The case, Janus v. AFSCME, involved a challenge to the practice of public sector unions charging “agency fees” to employees who decline to join the union but who still benefit from the deals it bargains.
And twenty-eight states have ridden the free market banner that have “right to work” laws banning agency fees. Such laws create a free-rider problem: People don’t have to join unions or pay agency fees to get the unions’ benefits, so the unions lose members and political influence.
There is an ongoing dispute over how much of the economic pie should be going to workers vs. the owners of capital, but not the fact that it has happened. Our badly degraded infrastructure and a warming planet tell us that public works have been badly neglected that would prepare US for future catastrophes as well.
The ongoing political and economic debate is how to right the fact that most of the rewards of higher productivity have not increased the public good, but diminished it. Mishel and Bivens are helping us to see that labor must have a greater voice in that debate.
“The number of job openings reached a series high of 8.1 million (yellow line in graph) on the last business day of March, the U.S. Bureau of Labor Statistics reported today. Hires were little changed at 6.0 million (blue line). Total separations were little changed at 5.3 million (red bar). Within separations, the quits rate was unchanged at 2.4 percent while the layoffs and discharges rate decreased to a series low of 1.0 percent.”
In the arts, entertainment and recreation industry, vacancies increased by 81,000 jobs, said Reuters. Vacancies also increased in manufacturing, trade, transportation, and utilities industries as well as in finance. Job openings rose in the Northeast and Midwest regions. But vacancies dropped in the healthcare and social assistance industry.
There is a red-hot demand for workers after what I call the pandemic recession. So we are essentially at the starting gate of the next growth cycle with first quarter GDP already showing 6.4 percent growth.
So economic indicators will show crazy numbers until we reach herd immunity and everyone—including teachers, day-care workers and government workers—are able to return to work. There are still 2 million fewer women and 1.5 million fewer men in the labor force than pre-pandemic levels.
This Calculated Risk graph says that companies are holding on to more of their employees with lower separations and quits, while last Friday’s unemployment report actually showed some 1 million new jobs were created, but just 266,000 above the normal seasonal rate of hiring.
The 2 million gap between Hires and Job Openings in the graph this means companies are looking for workers. But it will take time for workers to find suitable jobs, and employers perhaps to begin to raise their minimum wages for essential workers in the service sector (that are the lowest paid).
A record number of small businesses said they could not fill open jobs in April, as well, adding to a growing national controversy over whether extra unemployment benefits are keeping scores of people from re-entering the labor force. The extra $300 in jobless benefits was extended to September in Biden’s $1.9 trillion American Recovery Act.
Some 44 percent of small businesses said job openings went unfilled in April, according the National Federation of Independent Business. The NFIB is the nation’s largest small-business lobbying group.
And we have yet to see the enactment of an American Jobs Plan for massive infrastructure spending that will create even more jobs. Does that mean we will have a labor shortage with more then 8 million still out of work who say they are looking for work?
There are supply bottlenecks while companies ramp up production again, and the inflation rate is hitting new highs since the Great Recession. Will wages begin to rise as well from their lows of the last 40 years?
The consumer price index soared 0.8 percent to match the biggest monthly increase since 2009, the government said Wednesday. Economists had forecast a smaller rise. The rate of inflation over the past year jumped to 4.2 percent from 2.6 percent in the prior month — the highest level since 2008.
Wages have been held down for most workers by the rising power of corporations and weakening of labor unions since 1980. However, the trend is about to reverse as the demand for workers increases.
Will it cause the Fed to boost their short term interest rates? Fed Chair Powell doesn’t want to, but Treasury Secretary Yellen believes rates will have to rise if higher inflation continues.
Who is right? It is too early to tell. This also means the US economy is in for a wild ride this decade.