Jobs Create More Growth (Not Tax Cuts)

Popular Economics Weekly

Neither party seems to want to tackle the unemployment problem head on. Why? Conservatives have succeeded in shifting the debate to taming the budget deficit, when any improvement in the deficit depends on creating more jobs. It is not enough to shrink government spending, in other words, because that results in more lost jobs. Nor can the debt load shrink without growing tax revenues—either in absolute terms or as a percentage of Gross Domestic Product— and tax revenues do not grow unless employers hire more employees.

The lack of focus on job creation is unfortunate, as more than 15 million are still looking for some kind of full time work, and the labor participation rate of eligible workers has dropped below 60 percent, 6 percent below the norm. What has created more jobs to date? It has mostly been the manufacturing sector exporting to other countries due to the cheaper dollar exchange rate, and the dollar won’t remain so cheap once U.S. growth kicks into high gear.

Yet domestic spending is finally beginning to grow this year, even though banks are still reluctant to lend and wages and salaries are growing less than 2 percent, as opposed to more than 4 percent during good times. Auto companies have been the biggest booster to domestic spending as they continue to sell more vehicles, which has brought retail sales close to pre-recession levels. And that only happened with the government aid to GM and Chrysler. Government spending has never been the problem, in other words, with trillions of dollars being hoarded in corporations and banks that are not being put to use.

Although a large part of retail sales come from higher gas and food prices, overall retail sales on a year-ago basis in April were steady at 7.6 percent. Excluding motor vehicles, sales were up a year-ago 6.9 percent, compared to 6.8 percent in March. Strength was led by food & beverage stores (up 1.2 percent), nonstore retailers (up 1.0 percent), and miscellaneous store retailers (up 0.9 percent). Leading on the down side were electronics & appliance stores (down 2.2 percent), sporting goods, hobby, book & music stores (down 1.9 percent), and furniture & home furnishing (down 1.1 percent).

clip_image002

Another sign that consumer demand is increasing was the drop in business inventories which lag business sales, indicated by the stock-to-sales ratio which fell another tenth to what is a new record low of 1.23. This reading indicates that inventories are too low. But rising sales point ahead to rising production, rising inventory build, and rising employment as well.

clip_image004

In fact, the softer growth in the first quarter was largely due to a sharp upturn in imports, says Econoday (Import totals are deducted from exports as part of the GDP calculations.), some deceleration in personal consumption, a larger decrease in federal government spending, and decelerations in nonresidential fixed investment and in exports. They were partly offset by a sharp upturn in private inventory investment, as businesses seem to be anticipating more demand growth.

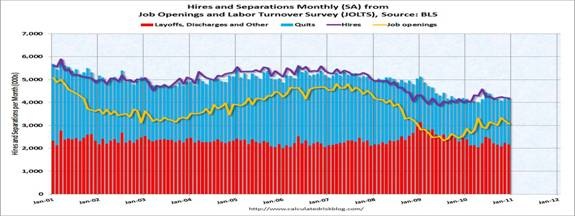
The Bureau of Labor Statistics’ monthly JOLT Survey gives us the best employment picture. It shows a steady increase in Job openings (yellow line in graph) from the low of 2 million in 2009 to 3.1 million in April 2011. The total number of monthly Hires is also above 4 million. It is the positive 200,000 plus average monthly difference in Hires vs. Layoffs plus Quits this year that tells us payroll jobs have been trending up.

clip_image006

In fact, consumer spending, which makes up almost 70 percent of GDP spending, is now leading the recovery as we said last week. This is because personal income is growing again (thanks in part to those manufacturing jobs), up 0.5 percent, following a 0.4 percent gain in February.  And the wages & salaries component also rose a moderate 0.3 percent, softening a little from 0.4 percent in February. 
 clip_image008

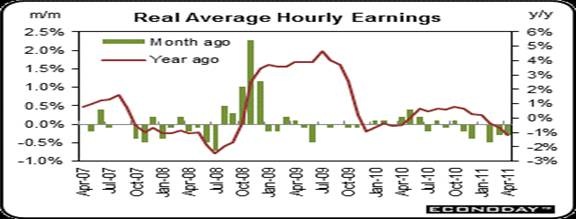
Consumers are seeing some erosion in spending power because of higher food and energy prices—the main reason for higher import totals.  Real hourly earnings are average hourly earnings deflated by the Consumer Price Index. On a year-ago basis, real hourly earnings were down 1.2 percent, compared to down 0.7 percent in March.  Indeed, real wages swing significantly as energy costs rise or fall sharply.  We saw a large gain in real wages in 2008 on the plunge in oil prices but the reverse is currently true.  In recent months, basically, consumer spending has been driven by pent up demand and job growth.  Individual spending power has fallen on average but aggregate earnings are up on higher employment.

The good news may be that as the dollar is appreciating again, consumer spending continues to pick up. So a higher dollar exchange rate while crimping exports, will moderate retail prices—especially oil and gas prices. Will this embolden the private sector to start spending some of their hoarded $trillions? There will be no significant deficit reduction until private investment picks up further. Since the focus on cutting government spending is in full swing, we have to hope that energy and food prices continue to soften, so that consumers can continue to recover.

Harlan Green © 2011
Posted in Economy, Weekly Financial News | Tagged , , , | Leave a comment

The Wrong Budget Debate

Financial FAQs

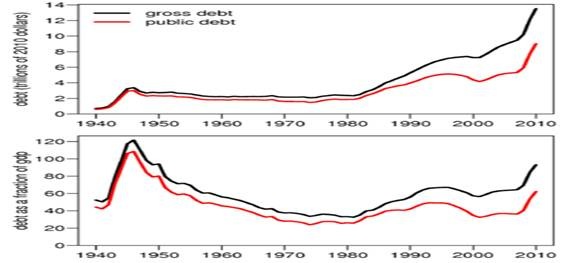
We are having the wrong budget debate. Washington is not talking about paying down the federal debt, which now totals some $9.5 trillion held publicly. Budget deficits are created when revenues don’t equal spending. So when the focus is only on cutting taxes and public spending by downsizing government and so public services—such as in protecting our health, the financial markets, the environment, education—and not increasing those revenues, then it doesn’t cure our budget problem. In fact, it just aggravates the problem, while putting more people into poverty.

The best example is the last time we had a balanced budget—in 1999. It was a time when Congress agreed to the Pay-as-you-go rules. Spending increases had to be balanced with revenue increases. And only when our economy was booming—21 million jobs were created during those years, and the highest income tax bracket was raised to 39 percent—were there enough revenues to pay down the debt. The debt that had been built during the 1980s by cutting taxes didn’t disappear by cutting spending, in other words.

This is obvious to the average household. Consumers know that, unless they pay down their debts the debt doesn’t go away. They are careful not to accumulate more debts, of course. But the real problem is how to shrink the debt by putting more of their income into paying it down, while spending less. Shrinking their incomes to pay down the debt doesn’t work, period.

Governments have had to do the same. Our largest public debt as a percentage of the economy was the 120 percent of GDP accumulated from WWII. It took the massive spurt in growth during the 1950s and 60s to pay it down to below 40 percent of GDP in the 1970s. It was accompanied by massive public spending on infrastructure (e.g., highways, education) that raised everyone’s standard of living—not just the wealthiest.

This was paid for by taxing the wealthiest among us, whose top tax bracket was 91 percent under Republican President Dwight Eisenhower. And by raising everyone’s standard of living, our economy prospered since prosperous consumers meant more demand for goods and services, hence more jobs.

The 1920s were a similar period of inequality as we have today. The top 1 percent income bracket controlled 23.5 percent of national income as now, when there was no unemployment insurance, deposit insurance, and social security to protect the savings of average consumers and the elderly.

Roosevelt’s New Deal corrected that problem and brought on the post-war prosperity by guaranteeing that most Americans could prosper.

clip_image002

As of January 2011, foreigners owned $4.45 trillion of U.S. debt, or approximately 47 percent of the debt held by the public of $9.49 trillion and 32 percent of the total debt of $14.1 trillion (that includes the social security trust fund). The largest holders were the central banks of China ($1.1 trillion) and Japan ($885 billion). The share held by foreign governments has grown over time, rising from 25 percent of the public debt in 2007 before the Great Recession.

One would think, therefore, that paying down debt should be the first priority of any U.S. administration. But the debate has been skewed by those who profit most from cutting taxes, without growing public revenues—Big Business, Wall Street, and their investors who have corralled 40 percent of the wealth of this country. It is obvious they care little about the debt, since they advocate cutting public spending without raising revenues needed to pay down the debt.

clip_image004

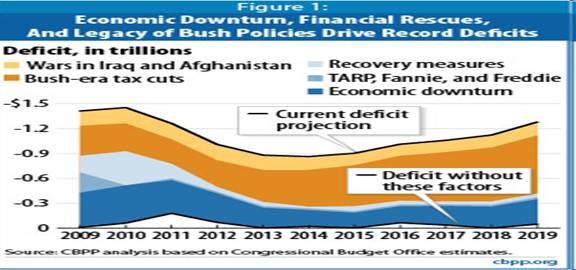
We know how the current federal debt was accumulated since 2000. The largest percentage—more than $3 trillion—came from the Bush tax cuts of 2001 and 2003, which reduced not only the highest income tax brackets from the Clinton era 39 percent to 35 percent, but reduced long term capital gains and dividend taxes that mainly benefit the wealthy to a maximum 15 percent. Then the Iraq and Afghanistan wars cost another $1 trillion of borrowed money. The Great Recession accounts for most of the rest of the deficit. So all this happened while reducing the income needed to pay for that debt.

Curing the budget deficit is really a common sense matter. We must grow our economy by boosting everyone’s income, in other words, not just that of the wealthiest, while holding our expenses. We did it in the 1990s. That can only happen with increased job formation, and a fairer tax code. Just cutting taxes that funnels money into the pockets of the wealthy, but cuts funding for research and development, programs that develop new talent by nurturing educational opportunities, and a regulatory environment that prevents excessive risk-taking by Wall Street, can only lead to more debt, not less.

Harlan Green © 2011

Posted in Economy, Macro Economics, Weekly Financial News | Tagged , , , , | Leave a comment

The Real Employment Picture

Popular Economics Weekly

Nonfarm payroll employment increased by 216,000 in March, and the unemployment rate was little changed at 8.8 percent, the U.S. Bureau of Labor Statistics reported today. It is a start, but we have a long way to go to have a sustainable recovery. The economy is in recovery mode—both manufacturing and the service sectors are expanding, in other words—but with lots of slack demand and empty facilities yet to fill.

clip_image002

Overall Gross Domestic Product is now back to producing what it did in 2007—that is, with 7.1 million fewer workers. Those unemployed mainly belong to the 80 percent of wage and salary earners who are actually earning less than before the Great Recession—if they even have jobs. The most difficult task will be to find decent jobs for the part timers and long term unemployed—those out of work for more than 6 months—if we are to bring back the sectors still lagging; real estate, construction and their corollary industries (insurance, building supplies, mortgages, etc). Real estate itself has shrunk to about 2 percent of GDP, when it averaged 7 percent over the last decades.

The last three months of job creation averaged about 160,000 payroll jobs per month. That is more than enough to keep up with the growth in the labor force, but it will only push the unemployment rate down slowly. Private payrolls were a little better at an average of 188,000 per month, as state and local governments continued to lay off workers.

In fact, economists say even if we are to maintain a 200,000 per month net job gain, it will still take until 2016 to get us back to anywhere near full employment. The decline in the unemployment rate from 8.9 to 8.8 percent was good news, though the participation rate was unchanged at 64.2 percent. This is the percentage of the working age population in the labor force, and is still below the 67 percent participation rate over the past 20 years.

clip_image002[4]

And so we still have to rely on manufacturing and booming exports for any growth at all. New orders, export orders and backlog orders slowed during March in an otherwise solid ISM manufacturing report. The composite headline index, which got a big lift from a slowing in supplier deliveries and from continued strength in production and employment, edged back only two tenths to a still very strong 61.2 that indicates month-to-month growth in overall activity at roughly the same level as February.

Government jobs fell 14,000, following a 46,000 drop in February.  For the latest month, state & local government declined 15,000 with 9,200 in local government education. The biggest negative in the employment report was for wages. The earnings picture in March is disappointing as average hourly earnings for all workers were flat, matching February. On a year-ago basis, wages were up only 1.7 percent, equaling the February pace, when earnings expand at 3 percent during good times.  Earnings clearly are lagging headline retail (CPI) inflation.

clip_image006

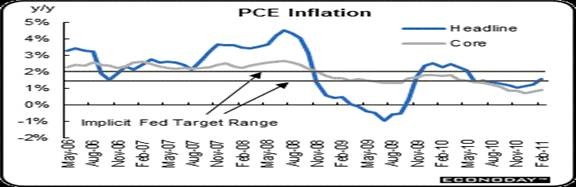
But we are seeing very little overall inflation in overall Personal Consumption Expenditures, even with exploding oil and food prices, which have more to do with the Mideast worries and droughts than longer term demand factors. On a year-ago basis, PCE prices are up just 1.6 percent in February—up notably from 1.2 percent the month before.  Core inflation nudged up to a 0.9 percent year-on-year pace versus 0.8 percent in January, still below the Fed’s target range of 1.5 to 2 percent.

Why so little inflation? Because two-thirds of product costs are labor costs, and incomes are barely keeping up with living expenses, as we said. We will know when there is sufficient demand to push up overall prices, when consumers stop looking for bargains and are willing to pay for higher prices in other than the necessities. And that won’t happen until most of those 7.1 million have found work again.

Harlan Green © 2011

Posted in Economy, Macro Economics, Weekly Financial News | Tagged , , , | Leave a comment

What to do with 30-year Mortgages?

The Mortgage Corner

Are 30-year mortgages a thing of the past? If so, too bad. Much of the debate over the future of Fannie Mae and Freddie Mac revolves around whether their main product—the 30-year mortgage—will disappear if Fannie and Freddie in their current form are dissolved. That would increase the costs (and decrease affordability) of home ownership.

Why the debate? Because 30-year mortgage are considered very risky extensions of long term credit, say privatization advocates, which require some kind of either explicit or implicit government guarantee and regulatory oversight. In other words, banks and other financial entities without those guarantees would want to offer shorter term fixed rate mortgages—say, with 15 to 20 year terms.

This is because shorter term mortgages have less risk, which is why loans tied to the Prime Rate—which can change overnight, and is now at 3.25 percent—offer the lowest rates for home equity mortgages, commercial lines of credit, etc.

The problem, however, is that 30-year amortized fixed rate mortgages provide the least risk to homeowners. A 30-year amortized payment is more affordable versus a shorter amortization term, and borrowers can rely on its fixed 30-year payment schedule to pay down their debt,. Though, in fact, the average life of a 30-year mortgage is seven years due to the mobility of American households.

Everyone agrees that 30-year fixed rate mortgages have made housing more affordable, and has boosted both the homeownership rate, and housing market in general. So the real debate is what to do with Fannie and Freddie, who have become government wards because of the Great Recession. Fannie guarantees some $1 trillion in mortgages, and holds $1.5 trillion in its own portfolio that has not been sold into the secondary market of mortgage-backed securities.

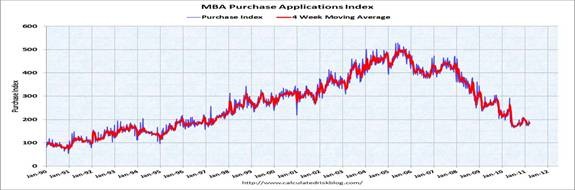
Treasury Secretary Timothy says we must be cautious in winding down their assets—maybe over a ten year period—so as to not flood the markets with too many mortgages, thus devaluing them. Mortgage activity is still low because of the housing bust, and Fannie and Freddie are its main conduits. The four-week moving average of the Mortgage Bankers Association purchase index is still at 1997 levels, and even with the large percentage of cash buyers recently, this still suggests fairly weak home sales through April.

clip_image002

Harvard economics’ Professor Ed Gleaser believes Fannie and Freddie should remain public entities, because if they were privatized, government would step in again, anyway, as they are entities ‘too big to fail’. “I support the public option not out of blind faith in the public sector, but out of profound skepticism toward mixed public-private models, like Fannie and Freddie,” said Gleaser. “The free-market friends of privatizing those entities envision a bold new world where the government no longer stands behind their debt. But if the last three years have taught us anything, it is that the government is not going to sit by and let a major part of the financial system fail.”

Barron’s Magazine has taken the privatization side of the argument in an August 28, 2010 article: “Today, Fannie (ticker: FNMA) and Freddie (FMCC) own or insure some $5.7 trillion of the $11 trillion U.S. mortgage market. Moreover, they provided around 75 percent of the funds flowing into the mortgage market in the past year.

“In a housing conference hosted by Secretary Geithner, there was some agreement that the government should either offer back-stop, catastrophic insurance on all residential mortgage securities, whether bundled by the GSEs, banks and other financial intermediaries,” said Barron’s, “or, perhaps, get out of the insurance game entirely except for affordable-housing investment pools. In other words, there would be no home-field advantage for Fannie or Freddie.“

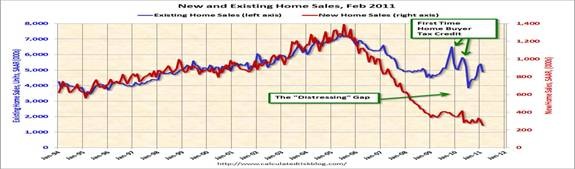
“The reason for their extreme caution? Both new and existing-home sales continue to decline, dropping 16.9 and 9.6 percent, respectively, in February. New-home sales are at a record low in part because of the large number of foreclosures flooding the market.

clip_image004

Whatever happens to Fannie and Freddie, Geithner asserted, they will have a much smaller footprint in the future so as to not pose a systemic risk. Among other things, the Government Sponsored Entities (GSEs) could lose the implicit government backstop on their corporate debt at some point so as to curb any future buccaneering. Or, perhaps, the GSEs would be restricted to buying mortgages or other securities merely for warehousing purposes, in anticipation of creating new mortgage-backed securities.

Harlan Green © 2011

Posted in Economy, housing market, Weekly Financial News | Tagged , , , , | Leave a comment

The Japanese Lessons

Popular Economics Weekly

The Japanese twin disasters—an earthquake plus Tsunami—have highlighted both why Japan’s economy has basically sputtered since its real estate and stock bubbles burst in 1989-91, and why ours is taking so long to recover—we were not prepared for the shocks.

Japan, the country best prepared for natural disasters, wasn’t prepared for a disaster of this magnitude, just as Wall Street believed in a free market ideology that said banks knew enough to avert financial disaster in policing themselves without adequate regulatory oversight.

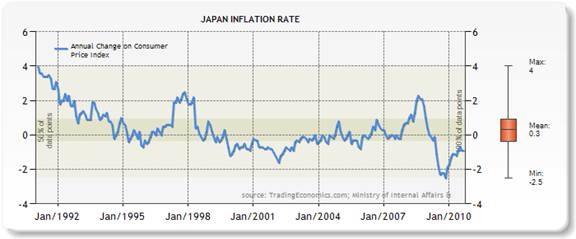
Just so, Japan wasn’t prepared for the bursting of its twin asset bubbles—in real estate and the stock market, when a single property in Tokyo briefly had a higher value than all of Manhattan. The result was real deflation, with prices falling for decades. And both Japan and U.S. wouldn’t put adequate resources to make up for the lost output, which is why our economy continues to sputter along.

In Japan’s case, it was because it chose to spend its monies trying to prop up failed institutions—rather than writing them off—because of the interlocking ownership of banks with corporations with real estate assets (called Keiretsu). So it couldn’t muster enough yen to stimulate more spending by its populace, who did what people instinctively do during recessions, they hoarded their assets in an attempt to keep them from losing value.

Deflation seems to be a puzzle that eludes even many economists. As Nobelist and former World Bank Chief Economist Joseph Stiglitz said recently in a Barron’s interview, “Money that isn’t spent lowers global aggregate demand”—i.e., can’t spur economic growth and so job creation.

And that is exactly what needed to be done. Dr. Stiglitz has called it Hoover economics, in memoriam of our President Herbert Hoover who tightened credit conditions at the beginning of the Great Depression, when he should have made credit easier.

clip_image002

“I am surprised that so many European leaders and some Americans, having seen the disaster of Hoover economics, are still going ahead with austerity,” he said, referring to the push by Germany and Great Britain to pay down their budget deficits. “The evidence is overwhelming that it will lead to an economic slowdown.”

The result for Japan has been an extended Great Recession, with falling prices and wages that has put it now in third place in GDP, according to the IMF, behind the U.S. and Chinese economies. We do know that deflation makes consumers more cautious. They tend to wait for prices to fall further (i.e., be discounted) before buying, whereas during inflationary times consumers react more quickly, thinking prices will be higher if they hesitate. And it is the money they spend, and not save, that circulates throughout an economy that increases aggregate demand.

clip_image004

Deflation, in a word, has been the great fear of Fed Chairman Ben Bernanke, a student of the Great Depression. And so he did not want a repeat of Hoover economics, which is why he has been pumping so much money into the U.S. economy via his various Quantitive Easing (QE) programs that have brought down interest rates on both Treasury Bonds and mortgages.

We have yet to learn the lessons of both the Japanese disasters and our own burst bubbles, according to Dr. Stiglitz. “Bernanke and Greenspan have to bear some responsibility for that ideology that bubbles don’t really exist, and they clearly do.” They weren’t prepared for the financial shocks, in other words. The lesson from Japan’s more recent disasters is that earthshaking events can happen, whether natural or manmade.

Harlan Green © 2011

Posted in Consumers, Economy, Keynesian economics, Weekly Financial News | Tagged , , , , | Leave a comment

More Jobs in 2011!

Popular Economics Weekly

The jobs market is in full recovery mode this spring. March seems to be the month when shoppers begin to shop in earnest and employers are hiring again. Both the service and manufacturing sectors of the economy are surging, labor productivity is high, and retail sales have shot up.

Nonfarm payroll employment increased by 192,000 in February, and the unemployment rate fell to 8.9 percent from 9.0 percent, the U.S. Bureau of Labor Statistics reported today.

clip_image002

December and January payrolls were also looking better. The change in total nonfarm payroll employment for December was revised from +121,000 to +152,000, and the change for January was revised from +36,000 to +63,000. The only real weakness was in government employment, which fell by 30,000. Local governments, many struggling with budget pressure, have cut 377,000 jobs since September 2008.

Retailers cut 8,000 jobs. Payrolls in goods-producing industries rose by 70,000 last month, including 33,000 in manufacturing. The sector has added 195,000 jobs since December 2009.

Activity for the bulk of the economy accelerated further in February from an already strong pace, according to the ISM’s non-manufacturing report where the composite index rose three tenths to 59.7. This reading is important because the service sector is two-thirds of U.S. economic activity. Anything above a reading of 50 shows month-to-month growth and because it was above January also shows month-to-month acceleration.

clip_image004

February’s strength is centered in output readings including acceleration for business activity (akin to a production reading on the manufacturing side) and in employment which came in at 55.6 for a more than one point gain and the best reading of the recovery, according to Econoday.

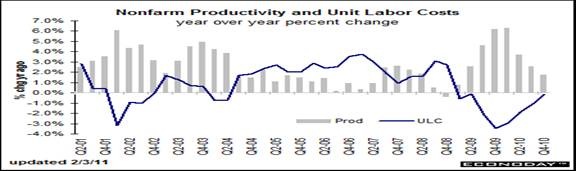
The 2.6 percent increase in Q4 labor productivity also signaled that employee costs are at an all time low (so no inflation danger), while workers productivity is maxed out (why hiring is picking up).

clip_image006

Year-on-year, productivity was up 1.9 percent in the fourth quarter-down from 2.9 percent in the third quarter. This is the most obvious sign that worker productivity—output per worker-hour—is maxed out. It is taking more hours for a single worker to increase output further, in other words.

Overall, the productivity and cost numbers have been favorable toward corporate profits as companies have squeezed more out of workers not laid off during the recent downturn. However, many economists doubt this pattern can continue and firms soon will have to boost hiring to maintain output and revenue gains.

The best sign of increased hiring is in fact state filings of weekly initial claims for unemployment, which has been plunging. Pointing strongly to month-to-month acceleration for payroll gains, initial jobless fell a substantial 20,000 in the February 26 week on top of a 25,000 decline in the prior week. The number of claims, at 368,000, is the third sub 400,000 reading in the last four weeks (note the February 19 week was revised 3,000 lower to 388,000). The four-week average, down 12,750 to 388,500, is the first sub 400,000 reading of the recovery, according to Econoday.

clip_image008

Lastly, though the 4th Quarter GDP economic growth estimate was revised down slightly to 2.8 from 3.2 percent, final demand, its major component including all sales by domestic producers, jumped 6.7 percent. This is a combination of domestic sales and exports, which have also been surging.

clip_image010

We can therefore say that combined with ballooning retail sales—annualized motor vehicle sales have climbed above 13 percent with U.S. companies like GM showing 40 percent sales’ increases, that we are finally in full recovery mode.

Harlan Green © 2011
Posted in Economy, Uncategorized, Weekly Financial News | Tagged , , , , | Leave a comment

Mortgage Delinquencies are Falling

The Mortgage Corner

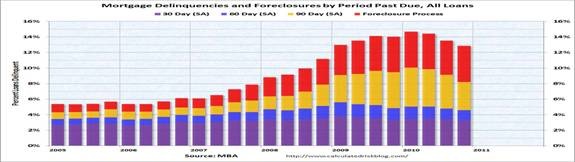
Mortgage delinquencies are declining—the kind that tell us we may be seeing an end to falling real estate prices. That is, there are fewer 30-day late payments, which are the first indicator of trouble leading to short sales and foreclosures. Most 30-day lates do get cured, as it may have been a payment oversight. Payments are usually 60-90 days late before the lender takes notice and may file a Notice of Default; signaling that the 90-day period has started before said lender publishes its Notice of a Foreclosure proceeding.

The delinquency rate for mortgage loans on one-to-four-unit residential properties decreased to a seasonally adjusted rate of 8.22 percent of all loans outstanding as of the end of the fourth quarter of 2010, a decrease of 91 basis points (almost 1 percent) from the third quarter of 2010, and a decrease of 125 basis points from one year ago, according to the Mortgage Bankers Association’s (MBA) National Delinquency Survey.

clip_image002

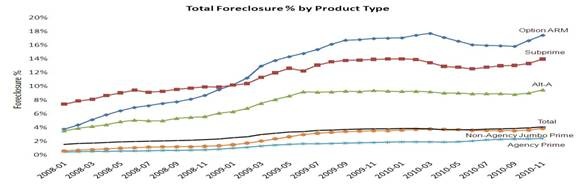
We are really talking about all the liar loans done from 2005 to 2007—the teaser rate Option ARMs, Subprime and Alternative documentation (Alt-A) loans that didn’t require income and maybe asset verification. The so-called Agency Prime (Fannie Mae and Freddie Mac) delinquency rate has always been less than 1 percent, as their qualification requirements have been the gold standard for underwriting mortgages. Not only do income and assets get verified, but also the likelihood of continued employment.

clip_image004

Jay Brinkmann, MBA’s chief economist said “These latest delinquency numbers represent significant, across the board decreases in mortgage delinquency rates in the US.  Total delinquencies, which exclude loans in the process of foreclosure, are now at their lowest level since the end of 2008.  Mortgages only one payment past due are now at the lowest level since the end of 2007, the very beginning of the recession.  Perhaps most importantly, loans three payments (90 days) or more past due have fallen from an all-time high delinquency rate of 5.02 percent at the end of the first quarter of 2010 to 3.63 percent at the end of the fourth quarter of 2010, a drop of 139 basis points or almost 28% over the course of the year.  Every state but two saw a drop in the 90-plus day delinquency rate and the two increases were negligible.”

clip_image006

Unfortunately, Reo, bank-owned properties are still making up 30 percent of home sales. But banks seem to be cooperating more with homeowners in trouble, as the short sales’ percentage of total sales has risen to 5 percent (i.e., those sales where existing lender agrees to cut mortgage principal to make the sale), which has brought down the percentage of foreclosure sales.

“While delinquency and foreclosure rates are still well above historical norms,” said Brinkman, “we have clearly turned the corner.  Despite continued high levels of unemployment, the economy did add over 1.2 million private sector jobs during 2010 and, after remaining stubbornly high during the first half of 2010, first time claims for unemployment insurance fell during the second half of the year.  Absent a significant economic reversal, the delinquency picture should continue to improve during 2011.”

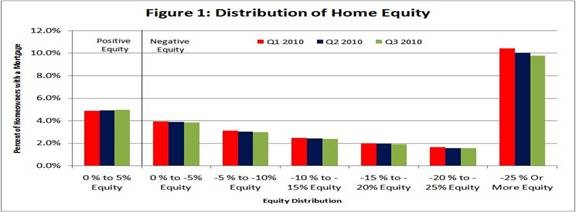
An interesting graph put out by Calculated Risk shows that up to 24 percent of all homeowners with mortgages are underwater, with 10 percent having mortgages which are more than 125 percent of their home’s value. It is this number that has to continue to decline, before the foreclosure rate declines substantially.

clip_image008

We know that it is ultimately the amount of available housing that determines whether housing prices will improve. And the huge number of distressed sales has added to the supply. Though prices have risen from their ‘double-dip’ lows in early 2010, there has to be a substantial drop in that supply—read drop in both foreclosures and short sales—for prices to begin a longer term rise.

clip_image010

So it may take the rest of this year for housing inventory to drop sufficiently to stop the decline in housing prices. Why? It takes a better jobs market to bring down the foreclosure rate, and so housing supply. This is turn boosts housing prices.

Harlan Green © 2011
Posted in housing market, Weekly Financial News | Tagged , , , | Leave a comment

When is Inflation a Problem?

Financial FAQs

Does it seem like the price of everything is rising these days—particularly food and gas prices? It really depends on who you talk to, and this is reviving the age-old debate between deficit hawks and doves. The old saw that inflation is first and foremost a monetary phenomenon was coined in the 1950s. Thank you, Milton Friedman, for the most simplistic formula ever to come out of academia.

Of course, he meant that inflation depended on the amount of money in circulation vs. the amount of goods available to purchase—the most basic Law of Supply and Demand. Wars tend to be more inflationary, because employment is high while much of production is tied up in making guns instead of butter. During recessions such as we just experienced, on the other hand, there is a surplus of goods and deficit of money in circulation. Fewer people are working, in other words, so they can’t buy as much.

And right now we are in a disinflationary trend—which means prices are falling, but there is still some inflation—vs. outright deflation such as Japan is still experiencing, where wages and prices are actually shrinking.

clip_image002

What is making the deficit hawks nervous is that headline inflation—i.e., overall inflation including food and energy prices—has been steadily rising since July, 2010. This is using the Personal Consumption Expenditure price index, which is the best overall measure of domestic prices. But the core rate without food and energy prices hasn’t budged. Why? Because consumers aren’t buying enough of the products and services affected by food and energy prices—such as motor vehicles (though demand for vehicles is rising).

clip_image004

Therefore, the overall inflation trend is still downward. The core rate came in unchanged after edging up 0.1 percent in November. On a year-ago basis, headline PCE prices are up 1.2 percent, compared to 1.1 percent in November. Core inflation eased to 0.7 percent year-on-year versus 0.8 percent in November.

clip_image006

What is happening to interest rates? Longer term rates are rising in tandem with the rising loan demand from consumers and businesses, as evidenced by the Treasury Yield Curve. Employment is picking up, in other words. Approximately 1 million jobs were created last year, of the more than 8 million jobs lost during the recession, and the unemployment rate has dropped to 9 percent from its 9.8 percent high.  But short term rates that control the Prime Rate and mortgage ARM indexes are still close to zero because of the Fed’s QE2 program of buying back Treasury Bonds.

So inflation is still way below the Fed’s ‘implicit’ target range of 1.5 to 2 percent. That is why the Fed wants to continue with QE2. Right now, the emphasis has to be on creating jobs, and keeping the inflation rate from falling further. For, falling prices mean lower profits for employers, which mean shedding jobs rather than adding them.

Then why are food and energy prices rising, if inflation is still low? Firstly, food prices have been rising because of major droughts in Russia, China and parts of Africa; major bread baskets of the world. And energy prices are rising because of rising energy us from the developing countries—including major population centers like China, India, and Brazil.

This means those prices are totally out of Federal Reserve control. In fact, some energy inflation is good because it speeds up incentives to convert to alternative fuels, which means cleaner energy use and less dependence on Middle East oil.

What about our soaring budget deficit? That is the other reason the Fed is pushing down interest rates. Right now, the costs of borrowing are at record lows. Something like just 10 percent of the federal budget goes to interest payments. So raising interest rates would only increase the budget deficit.

There is more good news on the hiring front. The Labor Department’s latest Job Openings and Labor Turnover Survey (JOLTS) said the number of job openings in December was 3.1 million (yellow line on graph), which was little changed from 3.2 million in November. Since the most recent series trough in July 2009, the level of job openings has risen by 0.7 million, or 31 percent. In December, about 4.162 million people lost (or left) their jobs, and 4.184 million were hired (this is the labor turnover in the economy) adding 20 thousand total jobs. Even with the decline in December, thought, job openings (yellow) are up significantly over the last year.

clip_image008

So there is a connection between inflation and interest rates. Rising interest rates are a sign that more money is in circulation—i.e., the demand for its use is rising. And that is a good thing at present. But inflation is more closely connected to employment, and past history says that inflation only becomes a problem when we get close to full employment—which is in the 6 percent range. That last happened in 2006 at the top of the housing and credit bubbles. And we are a long way from that place today.

Harlan Green © 2010

Posted in Macro Economics, Weekly Financial News | Tagged , , , | Leave a comment

Productivity Soaring–Where Are the Jobs?

Financial FAQs

In spite of Mideast unrest (when was it restful?), and the massive snow job hitting most of the U.S. (the biggest storm of the century?) the output of goods and services continues to improve. Businesses through the fourth quarter made the most of the workers already on payrolls, while resisting any temptation to add new employees to their payrolls. At some point, however, businesses will have to boost hours and hiring to grow, says Econoday, of the latest Labor Dept. release on labor productivity.  Where are those jobs coming from?

clip_image002

Unit labor costs—which make up two-thirds of product costs—are at record lows, which is why corporate profits are soaring while wages and salaries are basically stagnant. Businesses are still keeping a rein on labor costs, in other words. Workers are again producing as much as prior to the recession, but with approximately 7.2 million fewer jobs, according to Barron’s. This is while real compensation per hour adjusted for inflation actually fell 0.6 percent.

Nonfarm business productivity itself rose an annualized 2.6 percent in the fourth quarter after gaining 2.4 percent in the prior quarter. This gain in productivity reflects increases of 4.5 percent annualized in output in the nonfarm business sector and 1.8 percent in hours worked. Annual average productivity is up a whopping 3.6 percent, the highest in this decade.

Meanwhile initial jobless claims, the best predictor of job growth, continued to edge downward offering some hope to the unemployed, but remained above the crucial 400,000 weekly number that signals enough jobs are being created to absorb new entrants to the labor force. A weather-related pile up of claims in the South unwound in the January 29 week which saw initial claims fall a very steep 42,000 to 415,000 (prior week revised 3,000 higher to 457,000).

clip_image004

Alabama, Georgia, North Carolina and South Carolina posted some the biggest declines after the four states posted big increases in the prior week due to snow effects. Distortions always put the emphasis on the four-week average which, unfortunately, is signaling trouble for tomorrow’s monthly employment report. The four-week average is up 1,000 to 430,500 to show a roughly 15,000 rise from a month ago.

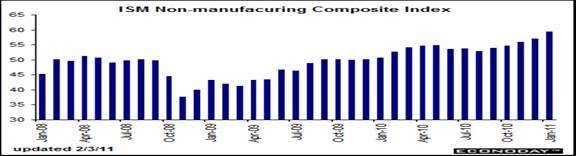
So the employment component of the ISM’s non-manufacturing (service sector) survey, a reading that offers a broad measure of labor demand, is more closely watched than ever since the service sector makes up two-thirds of our economic activity. This index jumped nearly two points in January to 54.5, by far the best reading of the recovery and pointing to a positive surprise for tomorrow’s big employment report.

clip_image006

January’s ISM non-manufacturing results are very similar to its report on the manufacturing side released on Tuesday. Gains are wide and convincing led by a nearly 2-1/2 point jump in the headline composite index to 59.4, also a recovery best. Details show especially strong monthly acceleration for new orders, a reading that points to greater acceleration for the broad economy in the months ahead.

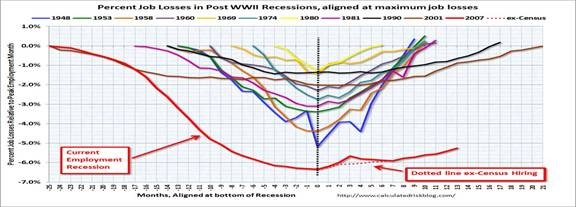
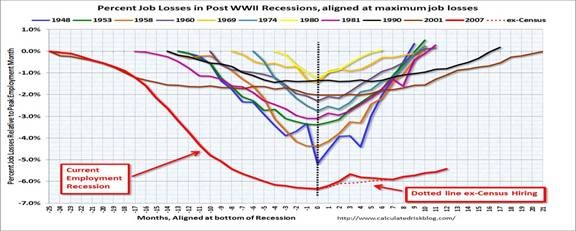
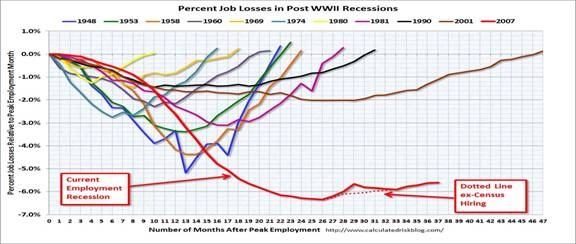
The pace of monthly job losses have slowed dramatically soon after President Obama and Congress enacted the Recovery Act in February 2009, as we have said, but is lagging past recoveries when job growth was as high as 6 percent, vs. the current paltry 2 percent growth rate. The trend in job growth this year has been difficult to discern because of the rapid ramp-up and subsequent decline in government hiring for the 2010 Census (which is now largely over), but private employers added a total of 1.3 million jobs to their payrolls in 2010, an average of 112,000 jobs a month.

clip_image008

The latest unemployment report showed the jobless rate dropping to 9 percent, with 600,000 more jobs added in the Household survey.  The payroll survey said most of those jobs were in manufacturing, in part due to the horrible winter.  Producers are only hurting themselves by hoarding their profits as they are now doing (to the tune of $2 trillion in cash on their books) instead of hiring more workers, as greater employment also means more demand for their products.

Harlan Green © 2010

Posted in Macro Economics, Weekly Financial News | Tagged , , , | Leave a comment

How Do We Boost Economic Growth?

Popular Economics Weekly

There is a tremendous misunderstanding of how to boost economic growth, and this is hurting the recovery. Conservative politicians want to cut taxes and government services, while progressives want to use government to boost growth. Yet it really doesn’t matter who does the boosting. The results are the same.

The best way to understand growth is with a concept used by economists, aggregate demand, that we have mentioned in past columns. Aggregate demand can be thought of as income and assets earned by consumers, private business, the financial sector and government. And it can be either hoarded in mostly MZM accounts (Money at Zero Maturity—i.e., earning 0 interest), as it is now, spent on things, or invested in facilities that produce more things.

Our economy has become seriously skewed during the past 10 years because corporate profits zoomed, while household incomes have not even kept up with inflation.

This is not the column to discuss the whys, including why so much income has migrated to the top 1 percent income bracket. But the result has been that most corporations haven’t invested in their employees. Which is why aggregate demand—the source of economic growth—has suffered mightily.

We know that consumers make up 70 percent of GDP growth, for example. So because their incomes were stagnant, they had to borrow to maintain their standard of living. And because they indebted themselves so heavily while their incomes remained stagnant, most have not been able to boost their spending during the recovery.

So business spending, which makes up the other part of aggregate demand (along with government spending) hasn’t been expanding because of so much excess industrial capacity. We know that excess capacity is still a problem today, as evidenced by the latest industrial production numbers.

Overall capacity utilization is improving, rising to 76.0 percent in December from 75.0 percent in November.  It is at its highest since a reading of 77.9 percent for August 2008, but is still far below the 82 percent long term average.

clip_image002[6]

Industrial production posted a healthy 0.8 percent gain in December, following a 0.3 percent rebound in November.  However, the boost was led by a monthly 4.3 percent surge in utilities output, following a 1.5 percent increase in November.  By market groups, strength was widespread.  Production of consumer goods increased 1.0 percent in December; business equipment, 0.6 percent; nonindustrial supplies, 0.1 percent; and materials, 1.0 percent.

clip_image004[6]

And because most profits have not been flowing back to average consumers, employers are not producing enough to warrant hiring more workers. That is the major reason for the entire government stimulus—to boost aggregate demand. The $787 Billion American Recovery and Reinvestment Act (ARRA) was in fact not enough to bridge the so-called lost output gap between potential and actual GDP growth over the past 2 years. The Fed’s purchase of government securities has held down interest rates, enabling businesses to borrow cheaply, and preventing real estate values from going into free fall.

Then what is the answer on how to create sustainable aggregate demand? The major push should be reestablishing the middle class that has been so decimated by loss jobs and much of its wealth—both in stocks and real estate. New York Times’ David Leonhardt is one of the few pundits to voice this concern in his most recent column, “In Wreckage of Lost jobs, Lost power,” in which he laments the loss of labor’s bargaining power.

Whereas employment in most other developed countries, including Japan and Russia, is much higher than in the U.S., corporate profits are lower. This is because U.S. domestic workers’ bargaining power has been severely diminished, in part because of laws that give employers the advantage in hiring and firing. And Germany and Canada, who barely had a recession, encourage companies to cut work hours for all during slowdowns—called ‘short work’—rather than lay off some, so that the pain of reduced incomes is spread over the entire workforce.

There are many other ways to cure insufficient aggregate demand, such as more progressive taxation. For instance, the top income tier during the Eisenhower years had a 95 percent tax rate on its top income bracket. This had the effect of siphoning off money from the wealthiest who spend the least percentage of their income, and putting it into the more productive use of building infrastructure, such as the interstate highway system, or education, or into more research and development.

Also, a better-run health care system would reduce health costs, which are double per capita in the U.S. vs. other developed countries. This would have several benefits, including increasing the competitiveness of U.S. made products, while boosting workers’ benefits and incomes.

clip_image006[6]

There is still almost $3 trillion in lost output—the difference between actual and potential GDP growth caused by the recession, as we said. But unless we get over the conservative-progressive divide on how to bridge that gap, we won’t be able to generate sufficient aggregate demand that will bring back the jobs and salaries lost during the worst downturn since the Great Depression. U.S. workers don’t care which sector generates their jobs, so neither should politicians.

Harlan Green © 2011

Posted in Macro Economics, Weekly Financial News | Tagged , , , | Leave a comment