Which Deficit is Most Important?

Popular Economics Weekly

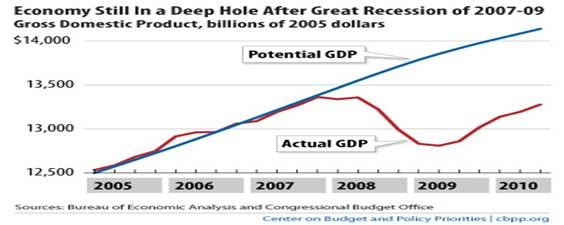
All the talk of budget deficits really focuses on the wrong deficit. It is the output deficit of goods and services lost because of the Great Recession that is most important, not the state and federal budget deficit(s), since budget deficits will only be paid down with increased tax revenues that come from increased production.
clip_image002

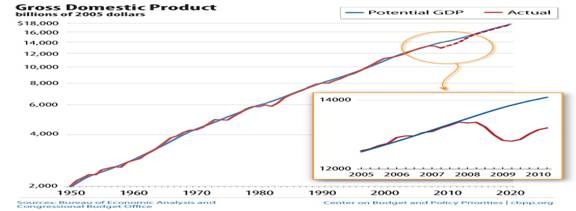
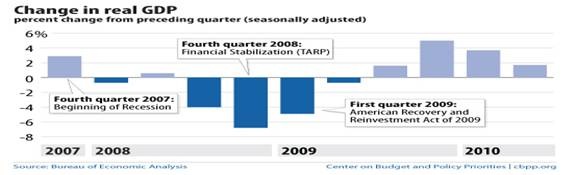
The Center on Budget and Policy Priorities (CBPP.org) has been tracking the output deficit since the beginning of the downturn, and it shows that overall production (GDP) has now returned to its 2007 level, hence the end of the recovery cycle we have been discussing. But for significant deficit reduction GDP now has to continue to expand to its potential above $14 trillion.

With the latest congressional compromise, analysts are predicting a higher GDP growth rate in 2011—which if true might boost growth to that $14 trillion plus level. The legislation’s extensions of federal unemployment insurance and Obama-era tax cuts for low-income households (i.e., the 2009 improvements in the Child Tax Credit, Earned Income Tax Credit, and college tuition tax credit) — all policies insisted upon by the White House — are a big reason for the increased estimate.

Economist Mark Zandi of Moody Analytics gave the best analysis of the compromise. “The deal’s surprisingly broad scope meaningfully changes the near-term economic outlook. Real GDP growth in 2011 will be nearly 4 percent, approximately 1 percentage point greater than previously anticipated. Job growth will be more than twice as strong, with payrolls growing by 2.6 million. Unemployment will be more than a percentage point lower; instead of hovering near 10 percent through the year, it will end 2011 well below 9 percent.”

In fact, economic growth has been subpar since 2000, with just 5 million jobs created 2000-08 and another 1 million jobs added since January 2010, after the loss of 8 million jobs during the Great Recession.

clip_image004

Most of the budget shortfall has been due to the lost revenues of the Bush tax cuts during the last decade, with military spending adding another $1 trillion, whereas the output deficit comes mainly from lost jobs—8 million from this recession alone, as we said. So the best revenue enhancer would of course be more robust growth. In fact, if GDP growth exceeded 3.5 percent longer term as it has over the last 75 years (i.e., including the Depression), social security would never be in danger of running out of funds. The current projections are based on a long term forecast 2.6 percent GDP average growth rate, which has never happened.

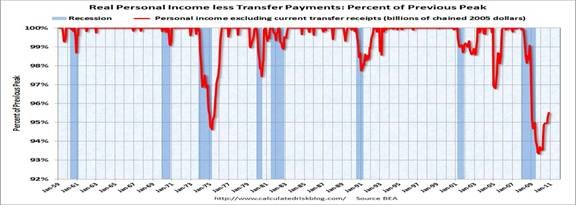
The bottom line is that higher GDP growth increases personal incomes, which began their most recent decline at the beginning of the Great Recession and only started upwards again after it ended in July 2009. Real, after inflation, personal incomes are currently 95.5 percent of the last peak, so demand can’t pick up substantially until consumers’ financial health is restored.
clip_image006

In sum, the best bang for the buck is boosting incomes of the middle and lower classes who were most affected by the Great Recession. Unemployment insurance has been the most effective boost for the 15 million unemployed, followed by the current one year-2 percent income tax cut for all wage and salary earners. Since consumers will no longer be able to rely on massive borrowing from their homes, they will only be able to spend money the old fashioned way, by earning it.

Harlan Green © 2010
Posted in Consumers, Macro Economics, Weekly Financial News | Tagged , , | Leave a comment

Is The Great Stimulus Debate Over?

Financial FAQs

The stimulus debate over what form government aid should take to the recovery is only over for the moment. The headlines tell us both the rich and poorer among us will receive various tax breaks under the Democratic-Republican Party compromise, while businesses will have their research and development (R&D) tax credits extended. This is bound to lead to more hiring, say most of the pundits.

What was the debate about? A hint was the House Democratic majority’s unsuccessful attempt to cut the inheritance tax exemption from $5m to $3.5 million. If the goal is over what gives the most bang for the buck, then it is important to know who will benefit. Economic growth is already back to its pre-recession level (See my Popular Economics Weekly column of this week.).

So the real debate yet to be settled is who will receive most of the benefits of the recovery. The Bush II recovery was fueled by tax cuts for the wealthiest, which brought us a wealth distribution that matched 1928 before the Great Depression. The theory being was that the investor class was in the best position to boost growth.

Alas, that didn’t happen, as just 5 million jobs were created from 2000-08 after the Bush II tax breaks, the lowest since WWII, vs. 22 million jobs created during the Clinton Administration (when tax rates were higher). Why? Incomes were much more eqalitarian then, creating much more demand from the income brackets that do most of the spending.

The solution really isn’t such a puzzle; more like common sense. The wealthiest tend to spend less of their incomes, whereas the middle and lower brackets spend almost all of their incomes. So simple math tells us the more income that flows to the lower income brackets, the more of it gets spent. And it is overall spending that fuels growth in our 70 percent consumer-driven economy.

What do the top income brackets do with their wealth, other than conspicuous consumption? They invest it, in part by lending it back to the rest of us. That happened from 2000-08. The record low interest rates engineered by Chairman Greenspan’s Fed created easy money that allowed the 90 percent income earners to borrow from the wealthiest 10 percent in record amounts. But, as Roosevelt’s Fed Chairman Marriner Eccles said during the Depression, the game ended once those players ran out of borrowed chips.

Though leaving the Bush tax cuts in place for those earning more than $250,000 per year benefits the highest income earners most, the other 90 percent also benefits somewhat with the temporary payroll tax reduction. Adding the 2 percent payroll tax cut lowers revenues to social security, however. The maximum tax drops to 12.2 percent from 14.2 percent, shared equally by employer and employee for salaried workers.

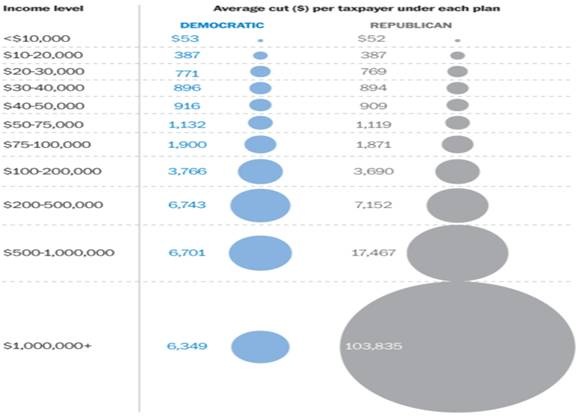
It is basically above the $500,000 annual income level that the Democratic and Republican Parties’ tax proposals differ. Preserving all the Bush II tax cuts boosts tax savings of the $500k to $1million incomes from $6,701 to $17,467 and for $1 million plus incomes from $6,309 to $103,835, a huge jump.

clip_image002

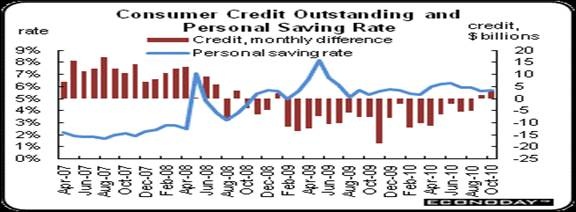
So the tax cut compromise doesn’t give as much bang for the buck as we would like. The strong retail sales report for November points to consumers feeling wealthier in certain areas, however. The latest (October) Federal Reserve consumer credit report showed consumer credit expanded $3.4 billion in October, following a $1.2 billion rise in September.  Outstanding credit has not risen for two consecutive months since mid-2008.  The latest rise was led by a $9.0 billion boost in non-revolving credit, following a $10.1 billion jump in September.  Both months reflect healthy motor vehicle sales.

clip_image004

Revolving credit, a category centered in credit cards, continues to contract, down $5.6 billion in October following September’s $8.8 billion drop. The decrease in revolving credit means consumers are not pulling out the plastic for purchases—disappointing news for retailers.   It also likely is due to continued charge offs by banks of bad loans, conjectures Econoday. 

Basically, consumers are still cautious about spending, maintaining a relatively high saving rate.  With so many of the tax benefits still going to the wealthiest, this means only a moderate pickup in overall consumer spending is sustainable. So it looks like the U.S. public will have to wait longer for a more egalitarian tax structure that both benefits most Americans, and pays our bills.

Harlan Green © 2010

Posted in Weekly Financial News | Tagged , , | Leave a comment

Redistributing Great Wealth (is) The Path to Recovery

Popular Economics Weekly

We are in the deepest economic malaise since the Great Depression. And there is a good reason for it. We also have the greatest maldistribution of wealth since 1928. Researchers are finding that the two—the greatest inequality and greatest downturns—are intimately connected. So restoration of what is in effect our Middle Class, where at one time the majority of wealth resided, would restore both the jobs and financial health to an economy sorely out of balance.

This will not be easy. Witness the vociferous opposition to any restoration of equality—which conservatives label the redistribution of wealth to those less worthy, in their eyes. The current example is Republicans refusal to give up the Bush tax cuts for the wealthiest, which would restore tax rates of the Clinton era when 22 million jobs were created.

The sad fact is that unless we do begin to level the economic playing field, we are fated to experience more boom and bust cycles that will only debilitate the U.S. economy further, and so our standing in the world. And history will continue to repeat itself. Roosevelt’s Federal Reserve Chairman, Marriner Eccles, understood in 1933 the main cause of the Great Depression.

“… a giant suction pump had by 1929-30 drawn into a few hands an increasing portion of currently produced wealth. This served them as capital accumulations. But by taking purchasing power out of the hands of mass consumers, the savers denied to themselves the kind of effective demand (my italics) for their products that would justify a reinvestment of their capital accumulations in new plants. In consequence, as in a poker game where the chips were concentrated in fewer and fewer hands, the other fellows could stay in the game only by borrowing. When their credit ran out, the game stopped.”

Thomas Piketty and Emmanuel Saez among others have documented the disappearance of Middle Class wealth (See Feb. 2003 Quarterly Journal of Economics). The Center for Budget and Policy Priorities (CBPP), a non-partisan think tank, using Piketty and Saez data, verify that income and asset inequality has risen to levels last seen in the 1920s (see graphs).

clip_image002[6]

Income disparities before that crisis and the recent one were the greatest in approximately the last 100 years, according to Harvard Professor David Moss, who is among a small group of economists, sociologists and legal scholars trying to discover if income inequality contributes to financial crises. In 1928, the top 10 percent of earners received 49.29 percent of total income. In 2007, the top 10 percent earned a strikingly similar percentage: 49.74 percent. In 1928, the top 1 percent received 23.94 percent of income. In 2007, those earners received 23.5 percent.

There is no good reason for such wealth disparity, in spite of the severity of this Great Recession. It was a problem that began in the 1970s and only now is catching public attention. An estimated 43.6 million Americans in 2009 were living off incomes below the federal poverty line, or around $11,000 for an individual under 65 or $22,000 for a family of four. The total number, an increase of 3.7 million over 2008, is the largest in 51 years, since the government first started tracking poverty data.

And that is the main reason for the slowness of this recovery. “It’s no coincidence that the last time income was this concentrated was in 1928,” wrote former Labor Secretary Robert Reich in a recent Op-ed. Professor Reich hedges his bets, however. “I do not mean to suggest that such astonishing consolidations of income at the top directly cause sharp economics declines. The connection is more subtle.”

This debate goes back to the Great Depression, as we have said. By effective demand, Eccles was referring to what economists today define as aggregate demand. Eccles was maintaining that the growth in income inequality created a credit bubble that burst and so led to an sharp diminishment in aggregate demand, which is measured today by our Gross Domestic Product.

The relationship is intuitively simple, yet was hard to verify before Piketty and Saez, et.al., did their research. As more income flowed to the top income brackets, middle and lower income classes had to borrow more to keep up their consumption patterns. And the easy credit available with the housing bubble accelerated that borrowing, to the tune of $2.3 trillion extracted from housing in the last decade. But then the excess of supply produced during the bubble caused housing values to crash, losing more than $4 trillion and counting of the $11 trillion in housing assets.

Professor Reich says we have to find ways to raise the wages of working people—the 90 percent who have suffered stagnant wages since the 1970s. Lowering payroll taxes for the lowest income earners who spend most of their incomes, while restoring the Clinton era taxes on those earning more than $250,000 is the most discussed remedy for such income disparity.

In fact, the underlying effects of such income inequality hasn’t been researched at all. But a new book by Professors Jacob Hacker and Paul Pierson, “Winner Take-all Politics”, is beginning to give us a picture of its results.

Publisher Simon & Schuster’s advertising blurb succinctly describes their thesis: “Winner-Take-All Politics—part revelatory history, part political analysis, part intellectual journey— shows how a political system that traditionally has been responsive to the interests of the middle class has been hijacked by the superrich. In doing so, it not only changes how we think about American politics, but also points the way to rebuilding a democracy that serves the interests of the many rather than just those of the wealthy few.”

There is some good news on the wealth redistribution front. Forty billionaires led by Warren Buffet and Bill Gates have pledged to donate one-half of their wealth to philanthropic causes. From Ted Turner to George Lucas, these 40 billionaires joined Warren Buffett and Bill Gates in making the pledge as part of their The Giving Pledge, a campaign launched earlier this year “to urge wealthy individuals to give the majority of their money to charities of their choice either during their lifetime or after their death,” said one headline. If only more of the superrich would follow their example.

Why would they do so? Because it not only helps to build their wealth, but the wealth of those who have lost so much to the wealthiest since the 1970s. This is an economic fact—that greater wealth equality creates more wealth for all—that is increasingly difficult to deny. We are only now becoming aware of the damage that such unequal wealth has wrought to our economy via the excesses of Wall Street and deregulation. It is something that economists weren’t really aware of until Piketty and Saenz did their groundbreaking research.

Harlan Green © 2010

Posted in Keynesian economics, Macro Economics | Tagged , , | Leave a comment

Why Such a Mortgage Mess?

The Mortgage Corner

What is causing the mortgage ‘mess’ to continue, in this case the controversy over ownership of mortgages that is embroiling Wall St. and Washington? Much of it is exaggerated by the media and attorneys for the plaintiffs suing various banks to take back those mortgages packaged and sold as mortgage backed securities. So it is not easy to understand the underlying facts, especially when real estate values have yet to stabilize.

The beginning of the mortgage origination process is fairly straightforward. When a bank, mortgage bank, or other entity originates a mortgage, it is either held by that lender in its “portfolio”, or sold to someone else. Many commercial banks still hold onto their shorter term loans—such as for businesses or construction projects. These are usually due within 5, and so don’t tie up a bank’s capital reserves for a longer period.

But most mortgages are permanent, meaning not due for 15-30 years. These are usually sold onto the secondary market—Wall Street firms who bundle them into mortgage pools that are sold to investors as mortgage backed securities (MBS). Some such securities for the VA/FHA, Fannie Mae, and Freddie Mac (the GSEs), are considered AAA rated, because either guaranteed or insured by the Federal Government. So someone holding a ‘Ginnie Mae’ Certificate knows it has an ownership share in a pool of AAA rated FHA/VA loans on which it receives a percentage yield.

The main ownership problem is that banks in particular may hold on to servicing the loan, even though it has been sold to investors. This means that said bank still collects the payments and passes them on for a fee of usually 3/8 to ½ percent of the loan amount. So if the ownership papers weren’t properly documented to the MBS investors, either servicers or investors may not have clear title to sell or auction the underlying property held as security if the property is foreclosed on.

Another ‘mess’ is if there was fraud involved—i.e., the loan originators didn’t follow their own underwriting guidelines when funding the mortgages. It is hard to believe that is the case, as lenders know they must buy back a loan if fraud—i.e., misrepresentation—is involved. But given the huge number of foreclosures—more than 2 million this year—so-called foreclosure mills in those 22 states who have judicial foreclosures may have taken shortcuts in not verifying all the documentation, or even faking lost documents.

Meanwhile, the delinquencies have declined substantially in 2010, and consumers incomes are improving–indicators that say real estate values may be stabilizing. And that is the bottom line in improving the foreclosure rate. Lenders tend to panic when housing values are falling, and so are quicker to foreclose in order to recoup as much as possible of loan principal.

Calculated Risk cites a report by LPS Applied Analytics that foreclosures leveled off at 3.92 percent, from a 1 percent historical rate and delinquencies at 9.29 percent in October, up from its historical 4 percent rate. So there is a long way to return to normal. Delinquencies began to take off at the beginning of 2007 (i.e., 3+ years ago), so it should take another 3 years to return to historical levels.

clip_image002

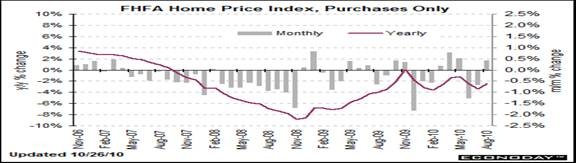
Home prices are coming under weakness again due to distressed sales adding to housing supply and tighter credit standards cutting demand, but that may be mainly to seasonal factors. Fewer homes are put on the market and sold during the winter months. The Federal Housing Finance Authority purchase only house price index for homes with conforming loans slipped 0.7 percent in September after no change the month before.

On a year-on-year basis, the FHFA HPI is down 3.4 percent, compared to down 2.8 percent in August. This index is based on resale prices for homes financed or bundled by federal housing agencies (i.e., the GSEs).

clip_image004

The price weakness is reflected in lower new and existing-home sales in October, down 2.2 and 14 percent, respectively. The National Association of Realtors also said the sales drop was mostly due to seasonal factors and tightened lending standards.

“A review of recently originated loans suggests that they have overly stringent underwriting standards, with only the highest creditworthy borrowers able to tap into historically low mortgage interest rates. There could be an upside surprise to sales activity if credit availability is opened to more qualified home buyers who are willing to stay well within budget,” said NAR chief economist Lawrence Yun.

The consumer is making a moderately strong comeback in October in both income and spending. Meanwhile, core inflation is subdued and still too low for Fed comfort. Personal income in October posted a healthy 0.5 percent gain, following no change in September. Income growth topped analysts’ forecast for 0.4 percent increase. Importantly, the wages & salaries component jumped 0.6 percent, following a 0.1 percent improvement the month before.

clip_image006

Household spending also showed strength. Personal consumption expenditures rose 0.4 percent, following a 0.3 percent increase in September. For the latest month, strength was led by a 1.9 percent monthly spike in durables. Nondurables advanced 0.8 percent while services edged up 0.1 percent.

The bottom line? If consumers continue to consume as much as during this holiday season, employers will hire more employees, which leads to more housing sales and higher prices. So we see slow and steady improvement and a return to normalcy in real estate sales and values over the next 3 years.

Harlan Green © 2010

Posted in Consumers, Weekly Financial News | Tagged , , | Leave a comment

The Fed Has Two Mandates—Growth + Price Stability

Financial FAQs

Why has there been so much debate over the Fed’s monetary policy of so-called Quantitative Easing? The simplest answer is that it pits those countries and ideologies that see the world as a zero-sum game—the I Win, You Lose crowd—vs. those who see the world as having enough wealth for everyone, if we would only share more equitably.

In fact, both sides of the debate mirror the Federal Reserve’s twin mandates—encourage maximum growth without excessive inflation. Among the I Win, You Lose crowd are those foreign countries who want to protect their export surpluses—read China, Germany, and Japan primarily—and the wealthiest individuals and creditors (read banks) who want to protect their wealth—i.e., don’t like deficits of any kind because it cheapens the value of their holdings.

Quantitative easing is the Fed’s policy of pushing down interest rates to encourage spending, instead of hoarding. We know that both consumers and businesses are holding onto their cash because of their loss of confidence in those financial institutions that almost brought down Wall Street. Household deposits held in such as banks and money market accounts are up 38 percent to $7.5 trillion over the past six years, according to the Federal Reserve, while banks have excess reserves they are not lending, and corporations more than $1.8 trillion in cash they are not investing.

Bernanke and the Fed Governors are with the Win-win crowd. They maintain that unless we all cooperate, so that the major exporting countries allow their currencies to appreciate, then everyone will be poorer. The U.S. will continue to lose jobs to the cheaper overseas wages of exporting countries, and the exporters won’t divert the resources necessary to develop their own domestic economies.

If China, for example, allowed its yuan to appreciate, goods would be cheaper for its own people, thus raising their standard of living. As it stands today, almost all that is made in China is exported, so China has to worry about inflation, since not enough is produced to satisfy its domestic demand for goods.

“Currency undervaluation by surplus countries is inhibiting needed international adjustment and creating spillover effects that would not exist if exchange rates better reflected market fundamentals,” Bernanke said in a recent speech to the EU.

Chairman Bernanke’s timing may be right. Economic indications have been strengthening going into QE2, gains reflected by two strong back-to-back 0.5 percent gains for the Conference Board’s index of leading economic indicators (September revised from plus 0.3 percent). A wide yield spread continues to be the biggest positive though to a smaller degree given declines underway in long rates, declines triggered and furthered by QE2. A rise in money supply, also related to QE2, is an increasingly significant plus. Another central positive is the factory workweek, strength that is likely to continue given the uplift underway in the manufacturing sector.

clip_image002

A rise in the M2 money supply, meaning money that is actually circulating in the economy, is what fuels growth. Because unless this money is put back into circulation—whether as investments in plants and equipment, or consumer goods and services—economic growth stagnates, as we have said.

But right now the M2 supply has risen just 2.8 percent since April, which is why some inflation indexes are at their lowest level in 50 years—since the Labor Dept. has kept records. And the Fed considers this level to be dangerously close to deflation.

clip_image004

The slow growing money supply is probably why the Personal Consumption Expenditure price index rose just 0.1 percent in September after rising 0.2 percent in August.  The core rate was flat after nudging up 0.1 percent in August.  Year-ago headline PCE inflation held steady at 1.4 percent.  Year-ago core PCE inflation fell to 1.2 percent from 1.3 percent the prior month.  Both series are below the Fed’s implicit inflation target of 1.5 to 2 percent, hence the deflation worries.

So is the Win-Win crowed right? Is there enough wealth for everyone, if we would only learn to share? Dr. Bernanke maintains that those countries who keep their currencies devalued harm their own people, by not allowing them access to a better life. While the developed countries have to increase growth to pay off their debt and find employment for their citizens.

Leaving aside politics, economists such a Robert Shiller believe there is enough wealth for everyone. In his groundbreaking book, The New Financial Order (2003, Princeton U. Press), Dr. Shiller postulates that though incomes are never guaranteed, they can be insured against ones profession. In fact, social security and unemployment insurance are limited examples. If insurance underwriters can calculate the rate of fires for fire insurance, or life expectancy for life insurance, why not that for professions? It is just a matter of accumulating sufficient data, which modern computer technology is now capable of doing. So that an policy can be taken out on one’s earning potential. When it falls below a certain level, insurance payments kick in, as with unemployment insurance.

We even have something that resembles it—the Earned Income tax credit for those earning annual incomes of less than $10,000. European Union countries have developed it even further. We know that enough is produced in the world to feed itself. The question is how to distribute it.

Harlan Green © 2010
Posted in Macro Economics, Weekly Financial News | Tagged , , , , | Leave a comment

QE2 Will Stimulate Economic Growth

Popular Economics Weekly

In a bid to stimulate banks to lend more by increasing their reserves, the Federal Reserve announced QE2 (Quantitative Easing 2). It will be buying up to $600 billion in Treasury securities from banks who hold them. We have no doubt this will kick start economic growth for several reasons. Not least, because there are signs of an additional pickup in both investment and hiring among small businesses.

In a New York Times’ column by Gretchen Morgenson, Ian Shepherdson of High Frequency Economics—noted for predicting the housing bust—sees growth increasing in the small business sector that creates the most jobs, because of a pickup in commercial and industrial bank lending.

And as commercial and industrial lending expands, Shepherdson maintains, it will unleash a pent-up demand among smaller companies for capital equipment, software, vehicles and other goods:

“The depression in small business pretty much explains everything in the weakness of this cycle,” he said. “I reckon in the last cycle they accounted for two-thirds of all new job creation. Not only are they big, they are better job-creation engines than big companies, which are more inclined to do their new hiring offshore.”

The deficit hawks maintain this will stimulate inflation down the road, because it puts too much money in circulation. But in fact buying back securities that banks have purchased from the U.S. Treasury doesn’t directly put money in the pockets of the consumers who spend it. It builds up banks’ cash reserves, which enables them to lend to small, as well as large businesses, as we have said.

Fed Chairman Bernanke downplayed the inflation danger in a recent Washington Post Op-ed: “Our earlier use of this policy approach (QE1) had little effect on the amount of currency in circulation or on other broad measures of the money supply, such as bank deposits. Nor did it result in higher inflation. We have made all necessary preparations, and we are confident that we have the tools to unwind these policies at the appropriate time. The Fed is committed to both parts of its dual mandate and will take all measures necessary to keep inflation low and stable, he said.”

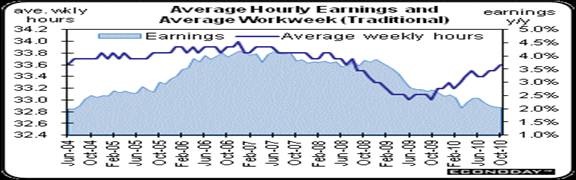
The big news was that October private nonfarm payrolls (excluding government jobs) jumped by 159,000, and September was revised upward to 107,000. With wages and hours worked also increasing, it looks like credit is already expanding. In fact, the $30 billion small business credit bill passed recently will also inject additional liquidity into small businesses.

Average hourly earnings gained 0.2 percent in October after rising 0.1 percent in September, while the average workweek for all workers edged up to 34.3 hours from 34.2 hours in October. The workweek has been on a rebound since mid-2009.  Between the gains in temp workers and the average workweek, one should expect a pickup in hiring as these two series typically rise before overall employment.

clip_image002

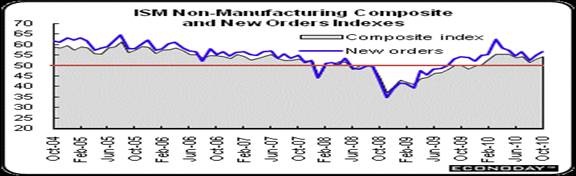
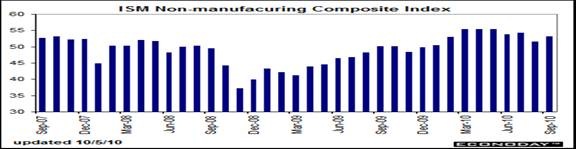
Service sector activity in October —which accounted for 154,000 of the 157,000 private payroll pickup—followed the manufacturing sector surge. So the bulk of the economy picked up steam in October, according to the ISM’s non-manufacturing index which rose 1.1 points in October to 54.3.  This survey of ISM members covers services, construction, mining, agriculture, and forestry.

clip_image004

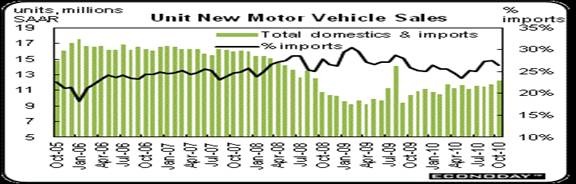
And lastly, motor vehicles sales continued to surge, as all 3 Detroit automakers reported surging profits, with GM on track to pay back its government bailout with an upcoming IPO. Combined domestic and import nameplate autos and light trucks (includes minivans, vans, and SUVs) jumped 4.2 percent to an annualized pace of 12.3 million units. While still below the cash for clunkers recent peak of 14.2 million in August 2009, the October number represents nearly steady growth from the recession low.

clip_image006

Deficit hawks tend to forget that some inflation is necessary for an economy to grow. The Japanese deflationary experience is crucial to understanding this. That is why the Fed is still in effect easing credit conditions by adding to bank reserves. And why small businesses should be the biggest beneficiaries of QE2.

Harlan Green © 2010

Posted in Consumers, Weekly Financial News | Tagged , , | Leave a comment

Rock Bottom Mortgage Rates Increase Sales

Financial FAQs

It seems that the lowest mortgage rates since the 1950s are making a difference. New-home sales rose 6 percent and existing-home sales increased 10 percent in September, “affirming that a sales recovery has begun”, said the National Association of Realtors. This can mean interest rates have finally come down to levels that match consumers’ diminished incomes—a vindication of the Fed’s efforts to lower interest rates in their fight against deflation.

Housing starts and construction spending are also beginning to rise, which means housing prices are in the affordable range, in line with lower reduced personal incomes.

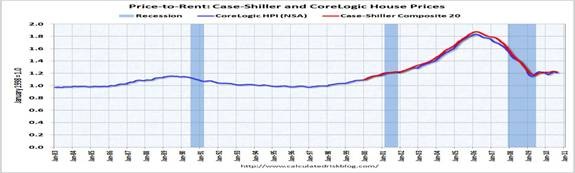
One measure of housing prices not usually reported is the housing price-to-rent ratio that we have discussed in past columns. It is a good measure because rents are more closely tied to actual incomes—and so what households can actually afford—whereas housing prices can fluctuate wildly based on irrational expectations, as we know. So its ratio is a measure of how much prices rise or fall in relation to rents. Today, that ratio has almost declined to historical levels, indicating that housing prices are bottoming out.

clip_image002

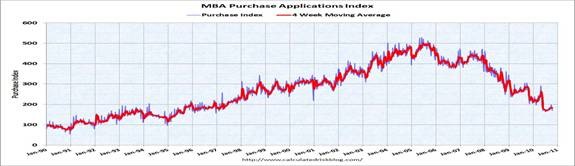
Mortgage purchase applications increased in the latest week, according to the Mortgage Bankers Association, another sign that record low interest rates are spurring purchases. Conforming 30-yr fixed rates are at 4 percent with a 1 point origination fee. The Refinance Index increased 3.0 percent; the seasonally adjusted Purchase Index increased 3.9 percent from one week earlier.

clip_image004

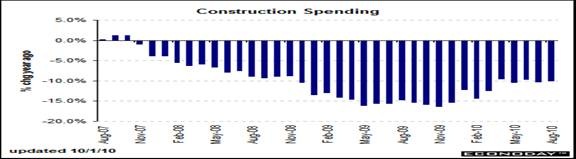
And construction outlays rebounded 0.4 percent, mostly in the public sector, following a revised 1.4 percent decrease in July. The August number was much better than the consensus forecast for a 0.4 percent decrease.

clip_image006

The comeback in August was led by a 2.5 percent boost in public outlays. Meanwhile, private residential spending dipped another 0.3 percent in August, though this number should improve with the uptick in housing starts. On a year-ago basis, overall construction outlays improved to minus 10.0 percent in August from down minus 10.3 percent in July, which means we will probably have to wait until next year’s selling season before construction spending actually turns positive.

clip_image008

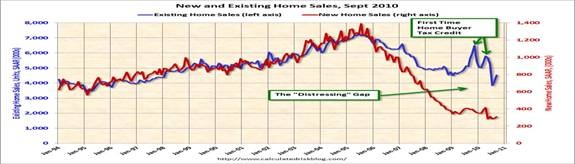
Calculated Risk gives us a reason for the decline in construction spending. The tremendous oversupply of existing homes on the market, including bank-owned foreclosures, are depressing prices and undercutting new home sales.

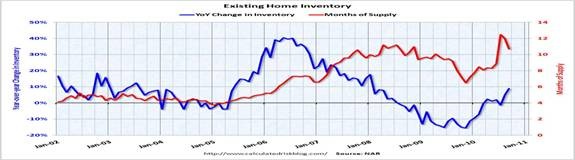
The existing-home overhang increased 8.9 percent in the month, even though months of supply dropped to 11 percent, due to the higher sales rate. “The year-over-year increase in inventory is very bad news because the reported inventory is already historically very high (around 4 million)”, said Calculated Risk, “and the 10.7 months of supply in September is far above normal.”

“Vacant homes and homes where mortgages have not been paid for an extended number of months need to be cleared from the market as quickly as possible, with a new set of buyers helping the recovery along a healthy path,” said NAR chief economist Lawrence Yun. “Inventory remains elevated and continues to favor buyers over sellers. A normal seasonal decline in inventory is expected through the upcoming months.”

clip_image010

And housing affordability conditions today are 60 percentage points higher than during the housing boom, so it has become a very strong buyers’ market, especially for families with long-term plans. “The savings today’s buyers are receiving are not a one-time benefit. Buyers with fixed-rate mortgages will save money every year they are living in their home – this is truly an example of how homeownership builds wealth over the long term,” said NAR President Vicki Cox Golder.

The latest Federal Housing Finance Authority same-home prices for Government agency financed homes—confirm that prices are firming at the lower price levels. The FHFA purchase index actually rose 0.4 percent, after a long string of declines.

clip_image012

The Mortgage Bankers Association asserted that fixed mortgage rates wouldn’t go lower at its annual conference, and in fact predicted they would rise above 5 percent next year, mainly because the MBA sees sales rising—with new-homes sales up 20 percent in 2011 and 40 percent in 2012 to make up for the current lack of new-home inventory.

But this will only happen if the Fed keeps downward pressure on interest rates, such as with their proposed QE2 purchase of more Treasury securities, to keep mortgage rates at such low levels that they conform with consumers’ reduced buying power.

Harlan Green © 2010

Posted in Consumers, Weekly Financial News | Tagged , , , , | Leave a comment

Zero Inflation Won’t Help Economy Grow

Financial FAQs

Fed Chairman Ben Bernanke in his most recent speech said that more Quantitative Easing may be necessary, in order to comply with the Fed’s longer-run sustainable rate of unemployment and the mandate-consistent inflation rate. The longer-run sustainable rate of unemployment is the rate of unemployment that the economy can maintain without generating upward or downward pressure on inflation. .

Bernanke maintained, “The longer-run inflation projections in our Summary of Economic Projections (SEP) indicate that FOMC participants generally judge the mandate-consistent inflation rate to be about 2 percent or a bit below. In contrast, as I noted earlier, recent readings on underlying inflation have been approximately 1 percent. Thus, in effect, inflation is running at rates that are too low relative to the levels that the Committee judges to be most consistent with the Federal Reserve’s dual mandate in the longer run.”

Why such a fear of too low inflation? Because it stymies growth. If prices are stagnant, then so are wages. And stagnant wages mean stagnant consumer spending, which leads to job layoffs in the highly competitive global economy.

clip_image002

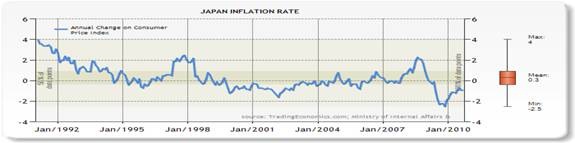
Bernanke’s fears are well-known on this subject, as he has studied the lost decades of the Japanese economy, as well as our Great Depression. The Japanese recession and deflationary spiral was caused by the bursting of both its stock market and real estate bubbles. And it has never recovered from the resultant deflation.

clip_image004

U.S. Headline inflation at the consumer level since 2008 is eerily similar. Although September’s positive retail sales report should have made the Fed happy, the CPI numbers will have the Fed still worried about inflation being too low. Year-on-year, overall CPI inflation slipped to 1.1 percent (seasonally adjusted) from 1.2 percent in August. The core rate in September edged down to 0.8 percent from 1.0 percent the prior month. The core year-ago pace is the lowest since February 1961 when it stood at 0.7 percent.

clip_image006

The downtrend in the core has been heavily dependent on low inflation or even deflation for the shelter component as fallout from the depressed housing market. On an unadjusted year-ago basis, the headline number was up 1.1 percent in September while the core was up 0.8 percent.

A good sign for growth is that overall retail sales in September advanced 0.6 percent, following a 0.7 percent gain in August (revised up from 0.4 percent) and a 0.5 percent increase in July (previously 0.3 percent). Although auto sales led a September gain, strength is broad based.

clip_image008

The gain in September was led by motor vehicle sales and electronics & appliance stores, up 1.6 percent and 1.5 percent, respectively.  On a positive note, there actually has been notable improvement in housing related components with furniture & home furnishings and building materials & garden equipment rising for three consecutive months.

The bottom line is that rising inflation is a sign of rising demand, whereas falling inflation—or deflation—is a sign of stagnation, or recession. The Fed is accomplishing two immediate objectives by keeping interest rates at rock bottom. The cheaper dollar stimulates exports and so jobs in domestic export industries such as aircraft, at the same time subsidizing record low mortgage rates, thus stabilizing home prices. We hope that businesses get the message. It is better for them to invest in the potential for growth than sit on hoards of cash earning zero interest.

Harlan Green © 2010
Posted in Consumers, Weekly Financial News | Tagged , , , | Leave a comment

When Will Hiring Improve?

Financial FAQs

All eyes are focused on the jobs market as September’s unemployment report showed progress in private hiring, but a loss of 50,000 education jobs, as states and local governments sliced more than 159,000 jobs off their payrolls. When will it get better?  On the positive side, national private nonfarm employment continued to rise, advancing 64,000 in September, following a revised increase of 93,000 the prior month.

Private service-providing jobs gained 86,000 after an 83,000 increase in August.  The rise was led by a 38,000 boost in leisure & hospitality jobs.  Other increases were scattered by category.  Temp help services advanced another 17,000 after gaining 18,000 in August.  This category typically is a leading indicator for permanent job hires or layoffs but companies are still more skittish than usual about adding permanent positions.

clip_image002

The jobs deficit from this recession is much larger than those in previous recessions.  The economy would have to create an average of over 300,000 jobs a month for two years just to return to the December 2007 level of employment — and even more to restore full employment, since the population and potential labor force are now larger. Most forecasters expect the economy to grow much more slowly than that, especially as the stimulus from the Recovery Act winds down.

Why is job formation so slow, when record corporate profits and a stock market rally pushing the DOW above 11,000? It has to do with the so-called “output gap” between potential and actual economic growth (measured as Gross Domestic Product, or GDP), which can be self-perpetuating without fiscal or monetary stimulus. The Great Recession has the greatest output gap since the 1930s, in part because of the busted asset bubbles, which reduced asset values without reducing debt.

clip_image004

In the second quarter of 2010, the demand for goods and services (actual GDP) was about $890 billion (7 percent) less than what the economy was capable of supplying (potential GDP) said the nonpartisan Center on Budget and Policy Priorities. This large output gap, which is manifested in a high rate of unemployment and substantial idle productive capacity among businesses, is the legacy of the Great Recession. Congressional Budget Office projections show the gap closing slowly over the next several years as actual GDP grows only moderately faster than potential GDP.

The real issue is how to stimulate that demand, which is the sum of consumer spending, private and public investments and net exports, as we have said in past columns. Since many consumers are tapped out, and businesses are waiting to see if there is any demand for their goods and services, government has to step in with investments—either by hiring more people, or investing in infrastructure, or in education and research.

And stimulus spending does work. The problem is there isn’t enough of it to bridge the $trillions in lost output since 2008. Paul Krugman once estimated that up to $6 trillion in stimulus spending was needed. Government has maybe $3 trillion to date in direct spending, including ARRA and TARP programs, along with total Federal Reserve securities’ purchases to keep interest rates at record lows. The Congressional Budget Office estimates the stimulus has created or saved up to 3 million jobs to date, which means it has kept the unemployment rate from climbing even higher.

clip_image006

It is not possible to know for sure what would have happened if policymakers had not responded to the economy’s problems with significant financial stabilization and fiscal stimulus measures. However, Former Federal Reserve Vice Chairman Alan Blinder and Mark Zandi of Moody’s Economy.com have done an econometric analysis which finds it would have been far worse with no policy response.

clip_image008

Blinder and Zandi say, the government’s policy response “probably averted what could have been called Great Depression 2.0.” They estimate that without TARP and the Recovery Act, GDP would have been nearly $1.4 trillion (in 2005 dollars) lower in the second quarter of 2010 than it actually was.

clip_image010

The question still is when that gap will be closed. One clue is the behavior of consumers. They are saving more while paying down debt in record amounts, so that debt-to-household income levels have dropped substantially. And, with wages and salaries increasing—which make up 80 percent of personal incomes—this should mean better growth and hiring prospects in the New Year.

Harlan Green © 2010

Posted in Weekly Financial News | Tagged , , | Leave a comment

Pending Sales Show Housing Improvement

The Mortgage Corner


The NAR’s Pending Home Sale Index, a forward-looking indicator of existing-home sales, rose 4.3 percent to 82.3 based on contracts signed in August from 78.9 in July. The data reflects contracts and not closings, which normally occur with a lag time of one or two months.

The NAR’s chief economist Lawrence Yun said the latest data is consistent with a gradual improvement in home sales in upcoming months. “Attractive affordability conditions from very low mortgage interest rates appear to be bringing buyers back to the market,” he said. “However, the pace of a home sales recovery still depends more on job creation and an accompanying rise in consumer confidence.”

Job creation was helped by the latest Institute of Supply Management’s service sector index, which showed month-to-month strength in September, an important indication for second-half economic growth. The ISM’s non-manufacturing composite rose more than 1-1/2 points to 53.2, right in line with the year’s trend which is 53.6. New orders had been slowing but picked up nicely, 2-1/2 points to 54.9.

clip_image002

The employment index in particular picked up 2 points as did supplier deliveries, while both new export and import orders soared, with export orders up a whopping 12 points in the index. A significant slowing in delivery times is a definitive sign of strength in this report, at 55.0 for the highest reading in more than two years. The non-manufacturing sector shows plenty of activity, in other words, news that should boost September’s employment report.

clip_image004

Another boost could come from consumers. Despite sluggish job growth, the combination of modest growth in average hourly earnings, private employment, and steady or firming weekly hours is gradually boosting wages and salaries—at least in the private sector.  Personal income in August advanced a healthy 0.5 percent, as we said last week, following a 0.2 percent rise the month before and beating the market estimate for a 0.3 percent rise.

Does the increase in pending home sales mean prices will stabilize? The S&P Case-Shiller (same) Home Price Index was still positive, but not as positive as in the spring, before the April expiration of the homebuyers’ tax credit.

clip_image006

The unadjusted data show strength, up 0.8 percent for the composite 10 for a fourth straight solid gain. But seasonal patterns play a big role in home prices and summer is a seasonally a busy time for the market with higher demand providing some lift for unadjusted prices.

The Pending Home Sale Index declined 2.9 percent in the Northeast to 60.6 in August, while it rose in all other regions. It rose 2.1 percent in the Midwest increased 6.7 percent in the South to an index of 90, and rose 6.4 percent in the West.

Will an improving economy boost employment? The signs are there, with falling labor productivity in Q2 indicating the existing workforce cannot produce more, and real estate showing a bit of life, in spite of the foreclosure backlog. It really looks like RE prices have bottomed out—in fact have been stuck in a range for more than one year—since May 2009, according to Case-Shiller.

So there is no reason for homebuyers to put off buying. It looks like employers are at least willing to boost the incomes and benefits of those 90 percent who are employed, in return for their longer hours.

Harlan Green © 2010

Posted in Weekly Financial News | Tagged , , , | Leave a comment