The Recession is (Really) Over

Popular Economics Weekly

The Great Recession is officially over. We really can breathe a sigh of relief—even though job formation is just now picking up, while major segments are still stagnating; such as real estate, and motor vehicle production. But stocks continue to rally, manufacturing is recovering, and exports are soaring.

The National Bureau of Economic Research (NBER), a non-profit panel of leading economic professors, said it actually ended in June of 2009, which is where this columnist saw it ending, as that was when overall output began to pick up.  But that is small comfort to those still out of work.

The announcement is still good news, as it may cancel out the pessimists who say we are still in a recession, or those who say we must begin to cut the deficit when the private sector isn’t yet creating enough jobs. And that will make a difference to consumers, most of who know little about economic signs, and so have to rely on their basic optimism or pessimism about future prospects in making their financial decisions.

The NBER said its determination of the recession’s end does not mean the U.S. is now healthy.

“In determining that a trough occurred in June 2009, the committee did not conclude that economic conditions since that month have been favorable or that the economy has returned to operating at normal capacity, NBER said. “Rather, the committee determined only that the recession ended and a recovery began in that month.”

It was an 18-month recession, the longest in fact since the 1929-33 first Great Depression, which lasted 43 months. This is why the economy is taking so long to recover. In other words, it began to contract in December 2007, the official beginning of the recession, and the contraction ended in June 2009.

That is probably the reason the press release of the Fed’s Open Market Committee (FOMC) latest meeting hinted at more credit easing in the fall, as it sees a danger of actual deflation, rather than lower inflation. Deflation is the danger most feared by economists at present, since lower prices also mean stagnant economic growth as well.

“Measures of underlying inflation are currently at levels somewhat below those the Committee judges most consistent, over the longer run, with its mandate to promote maximum employment and price stability”, said the release.

The “somewhat below” language is in contrast to “measures of inflation have trended lower” in the previous statement, said Econoday. With inflation below the Fed’s implicit inflation target, the Fed appears to be stating that inflation is too low, which was the case in 2002, when the Fed was faced with the same dilemma. So the Fed is saying that the deflation risk is higher than the re-inflation risk and the door is now open to additional quantitative easing.

Why is some inflation important? It would mean there is sufficient demand for products and services to warrant expanding production, which means consumers are willing to increase their spending, in a word. Decades-long deflation is why the Japanese economy is no longer the Asian Tiger, with China taking its place as the world’s second-largest economy behind the U.S.—at least on paper.

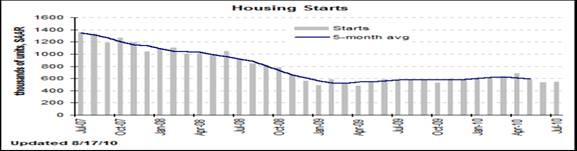
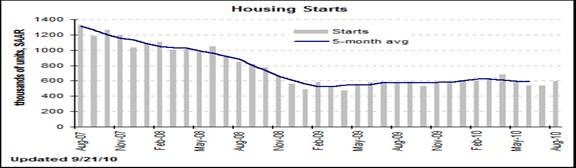
There was some good news on the housing front, which could signal that the housing bubble is finally bottoming out. Housing starts in August jumped 10.5 percent after rising a modest 0.4 percent in July. The August annualized pace of 598,000 units clearly topped analysts’ expectations for 550,000 units and is actually up 2.2 percent on a year-ago basis. The gain in August was led by a 32.2 percent surge in multifamily starts, following a 36.0 percent increase in July. The single-family component rebounded 4.3 percent after dipping 6.7 percent in July.
clip_image002

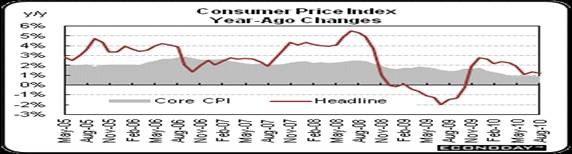
The August Consumer Price Index reading confirms why the Fed is concerned about deflation. Year-on-year, overall CPI inflation slipped to 1.2 percent (seasonally adjusted) from 1.3 percent in July. The core rate in August was steady at 1.0 percent. These numbers are well below the bottom of the Fed’s implicit target range for inflation of 1-1/2 to 2 percent for the PCE price index, which this writer believes should be raised to 2-1/2 to 3 percent to encourage higher salaries—which are two-thirds of product costs, as we have said.
clip_image004

So will the latest news lift consumers’ spirits? Firstly, prices have to stop falling, so that employers will be encouraged to hire. That is why further stimulus measure are so important. We cannot afford to repeat Japan’s experience, and so lose our place as the world economic leader.

Harlan Green © 2010
Posted in Weekly Financial News | Tagged , , , | Leave a comment

The Jobs Are Coming

Popular Economics Weekly

The August unemployment report supported both sides of the stimulus debate. Democrats said it showed more stimulus was needed, while Republicans said employers were holding back because of too much government—too many regulations and a soaring deficit meant higher taxes down the road.  Yet jobs are returning, in spite of the political gridlock. But with all the doom and gloom, one has to look closely at the numbers to see this.

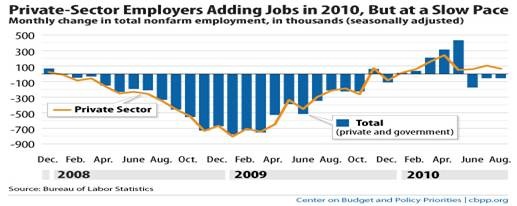
Overall payroll employment fell 54,000 for the third straight month in August, though there was a moderate gain in the private sector, with private job hiring rising 67,000. Also on the positive side, wages were up. And the companion Household Data survey that actually computes the unemployment rate (9.6 percent) showed 886,000. additional “private wage and salary workers in all nonagricultural industries except private households”. And the May-August monthly average of 285,000 was only slightly down from the January-April average of 328,000. It tracks the self-employed as well as payroll workers, hence may be a more accurate measure of employment.

In fact, there is no evidence that a fear of higher taxes (for the wealthiest) deters employers or consumers. More than 23 million jobs were created during the Clinton years, when tax rates for the wealthiest were higher.  This brought the unemployment rate below 5 percent and the first budget surplus in a generation by 1998. Everyone is hewing to their ideological lines during this election year, in other words, regardless of the realities.

clip_image002

The realities are that employers are trying to squeeze maximum profits from their existing workforce, but that is no longer working. The best evidence for this is the latest labor productivity report that indicated very little additional output was coming from the existing workforce while labor costs were rising. Ergo, workers want more pay and benefits for even a small additional increase of output. And so employers must begin to hire more workers, if they want to keep their productions costs down.

Average hourly earnings improved to 0.3 percent from up 0.2 percent in July. The August number topped the market estimate for a 0.1 percent gain. The average workweek for all workers was unchanged at 34.2 hours in July. The market forecast was for 34.2 hours.

clip_image004

But incomes are still barely rising, which is hurting demand for more goods and services. Due to the slowdown in output and businesses already having cut labor costs to the bone, productivity fell notably in the second quarter. Nonfarm business productivity declined an annualized 1.8 percent in the second quarter after a 3.9 percent advance in the prior quarter.

Unit labor costs (i.e., costs per worker) rebounded an annualized 1.1 percent in the second quarter, following a drop of 4.6 percent in the first quarter. Year-on-year, productivity was up 3.7 percent in the second quarter-down from 6.3 percent in the previous quarter. This is still a good number, and way above the longer term 2.5 percent productivity growth average.

So where and when will employers hire enough workers to begin to bring down the current 9.6 percent unemployment rate? They would have to more than double current numbers—to 125-150,000 new payroll jobs per month just to keep up with new workers entering the jobs market, according to the Establishment payroll survey.

Both the manufacturing and service sectors are still expanding, per the Institute of Supply Management (ISM), with manufacturing activity up most in the August survey. Private service providing jobs rose 67,000 after a 70,000 boost in July, with a 45,000 boost in education & health services, and health care is up 40,000. Goods-producing jobs were unchanged in August after a 37,000 advance in July, but that will probably also rise next month, with the new ISM data.

So we know that employers will begin hiring again, with the continued growth in both sectors, but without rising wages it won’t boost economic growth. More stimulus is needed, such as better social safety net programs for those who have to accept jobs for lesser pay during recessions—which is one reason demand has fallen so sharply during this recession?

One suggestion from former Labor Secretary Robert Reich is an “earnings insurance” that will pay the difference between old and new salaries for 2 years, similar to Germany’s, which has kept their unemployment rate around 8 percent. It would be cheaper than extended unemployment insurance, he maintains, and put more people back to work.

The bottom line is as Professor Reich says in his most recent New York Times op-ed—income inequality today equals that of 1928. And in both 1928 and 2008, the richest 1 percent of American households took in 23.5 percent of total income, whereas it was just 9 percent in the 1970s. The median (i.e., middle class) male worker earns less today when adjusted for inflation that he did 30 years ago. No economy can grow unless we bring back the middle class, in other words.

Harlan Green © 2010

Posted in Uncategorized, Weekly Financial News | Tagged , , | Leave a comment

When Will Real Estate Recover?

The Mortgage Corner

Ah, that is the $64,000 question we have been asking since 2008, when housing imploded. Where are conditions improving, if anywhere? The Fed announced it would continue to hold down interest rates, and loan modifications are helping to cut into the foreclosure inventory, which has declined slightly from its highs.

The S&PCase-Shiller same-home price index, the best measure of price changes, rose in 19 of its 20 metropolitan areas in May, with San Francisco,San Diego, Minneapolis, and Los Angeles most improved. Prices in its 10-city index rose 5.4 percent, and 4.6 percent in its 20-city index. But in spite of 3 consecutive monthly increases, S&P said prices were still moving sideways—which probably means they expect prices to decline in June and July after expiration of the tax credit deadline.

clip_image002

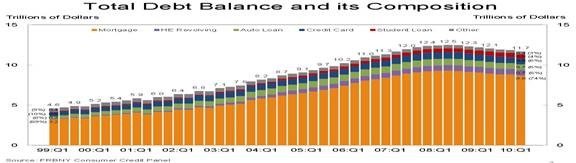
Prices have stabilized, in other words, but consumers are not yet convinced that the jobs picture will improve. So consumers continue to pay down mostly mortgage debt, says a New York Fed quarterly report on household debt and credit.

“Aggregate consumer debt continued to decline in the second quarter, continuing its trend of the previous six quarters,” said the report. “As of June 30, 2010, total consumer indebtedness was $11.7 trillion, a reduction of 6.7 percent from its peak level at the close of 2008Q3. Excluding mortgage and HELOC balances, consumer indebtedness fell 1.5 percent in the quarter and, after having fallen for six consecutive quarters, stands 8.4 percent below its 2008Q4 peak.”

clip_image004

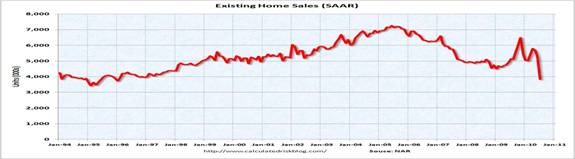
This has not helped new and existing-home sales, also recovering from expiration of the first-time homebuyer’s tax credit. Existing-home sales, which are completed transactions that include single-family, townhomes, condominiums and co-ops, dropped 27.2 percent to a seasonally adjusted annual rate of 3.83 million units in July from a downwardly revised 5.26 million in June, and are 25.5 percent below the 5.14 million-unit level in July 2009.

Sales are at the lowest level since the total existing-home sales series launched in 1999, and single family sales – accounting for the bulk of transactions – are at the lowest level since May of 1995, but actual totals are still lower than one year ago.

clip_image006

To put that number in perspective, according to the NAR, existing-home inventories increased to 3.98 million units in July from 3.89 million in June, piling up because of the lower sales rate. But the all time record high was 4.58 million homes for sale in July 2008, so inventories have actually declined 1.9 percent year-over-year. Inventory is therefore very much dependent on the sales’ rate.

clip_image008

So there are some signs of improvement. The latest Federal Reserve survey of Senior Loan Officers also indicated an easing of credit requirements for both residential and commercial loans over the past quarter, the first easing since 2008.

And delinquency rates are declining, according to the Q2 Mortgage Banker’s Association report. The seasonally adjusted delinquency rate stood at 5.98 percent for prime fixed loans (which make up some 60 plus of outstanding loans), 13.75 percent for prime ARM loans, 25.19 percent for subprime fixed loans, 29.50 percent for subprime ARM loans, 13.29 percent for FHA loans, and 7.79 percent for VA loans.

clip_image010

What is obvious is that the percentage of 90 day-late payments and foreclosures is increasing as a share of total delinquencies as lenders speed up the process of modifications and foreclosures to get delinquent loans off their books. The percentage of loans on which foreclosure actions were started during the second quarter was 1.11 percent, down 12 basis points (0.12 percent) from last quarter and down 25 basis points from one year ago.

The delinquency rate includes loans that are at least one payment past due but does not include loans in the process of foreclosure.  The percentage of loans in the foreclosure process at the end of the second quarter was 4.57 percent, a decrease of six basis points from the first quarter of 2010, but an increase of 27 basis points from one year ago.

“Consumers rationally jumped into the market before the deadline for the home buyer tax credit expired, said NAR economist Lawrence Yun. “Since May, after the deadline, contract signings have been notably lower and a pause period for home sales is likely to last through September,” he said. Even with sales pausing for a few months, annual sales are expected to reach 5 million in 2010 because of healthy activity in the first half of the year. To place in perspective, annual sales averaged 4.9 million in the past 20 years, and 4.4 million over the past 30 years,” Yun said.

Since sales’ statistics are notoriously imprecise (with ± 15 percent error), we can say that real estate sales have been treading water after an initial sales spurt in 2009, though existing-home prices actually increased 0.7 percent in July, indicating that expiration of the tax credits caused most of the sales’ decline in the lower-end of the market.

The bottom line is that banks seem to be finally committed to cleaning the bad loans off their books. This will probably keep prices from rising in the short term. But it will also enable them to reduce their loan loss reserves and so ease credit conditions for home buyers further, thus reducing inventories and boosting sales further.

Harlan Green © 2010
Posted in Uncategorized, Weekly Financial News | Tagged , , | Leave a comment

Beware of Extraordinary Times

Popular Economics Weekly

Yes, Beware of Extraordinary Times is a much used saying these days.  It also applies to the extraordinary polarization of ideas in the economics profession at present. This is an election year, of course, which has distorted the debate on economic recovery.

We know that debt is bad, for instance, but borrowed debt is worse, says Alan Greenspan. So allowing some of the Bush-era tax cuts to expire may be a good thing, since those tax cuts reduced revenues while increasing the budget deficit. And the truism that one has to spend money to make money applies to government as well as the private sector. The just-ended Great Recession required government to borrow huge sums of money to make money—i.e., just to keep the U.S. economy afloat.

Government stepped in because the private sector downsized, shedding more than 8 million workers and shutting down whole sectors of the economy—both small businesses and large, from autos to airlines.

So it should be a no-brainer that government and the private sector need to find better ways to work together, rather than participating in the demonization that has caused such an extraordinary polarization of ideas—all government is inept, for instance, and all capitalists selfish and greedy. One area that both sectors should agree on is how to stimulate the demand that grows an economy. And right now there is little agreement on how to simulate economic growth.

Conservatives maintain we must pay down debt, and decrease government spending to stimulate economic growth—private business lives in eternal fear of debt and so won’t choose to expand when they worry about higher debts and future inflation, they say. While so-called liberals (who were at one time Eisenhower Republicans) believe that without government intervention during recessionary times, economies will stagnate and unemployment remain unacceptably high.

But in fact both government and the private sector are a part of what is called aggregate demand, the demand that stimulates economic growth. It is a relatively simple formula:

clip_image002

Where aggregate demand is AD,

    • clip_image001is Investment,
    • clip_image002is Government spending,
    • clip_image003[4]is Net export,
      • clip_image004[4]is total exports, and
      • clip_image005[4]is total imports = am + bm(Y − T).

    Notice there is no mention of debt in the formula. Our Gross Domestic Product is its closest approximation, and the classical definition of a recession/depression is when GDP shrinks for at least 2 quarters. It shrank more than 4 quarters during this Great Recession, which is the main reason these are such extraordinary economic times.

    The fact that we are fighting two wars with borrowed money, while recovering from a credit crisis and housing bubble that resulted from too much borrowed money, means that extraordinary measures are required. We must bury the hatchet between government and the private sector—doing nothing is not an option.

    Historical hindsight tell us it was too little government regulation—both due to outmoded laws and lax oversight—and a private sector obsessed with profit over prudence that caused the Great Recession.

    This has resulted in some $6 trillion in lost output of GDP, which could have been worse, if government had not come to the rescue.

    clip_image010

    Zero interest rates are scary during ordinary times, certainly. It is scary to savers and lenders, because it reduces their incomes. And it is scary to consumers because it signals falling prices, with lead to falling wages and fewer jobs.

    But unless said aggregate demand begins to grow again, stagnation will continue. At present there is very uncertain growth, mainly because banks, investors and corporations are hoarding their assets. Corporations are hoarding their cash from a decade of record double-digit profits, investors from their stock and bond losses, banks because they are reluctant to lend until their capital base has been restored, while consumers continue to restore their wealth and wait for businesses to hire again.

    It has been left to government to provide some stimulus during these times to satisfy the most basic human needs of shelter and food, by borrowing from the almost $1 trillion in excess bank reserves held by the Federal Reserve (that banks are not using) and $1.8 trillion in cash that corporations are hoarding.

    In other words, when I + C + X-M falters, then the G of government has to provide the stimulus. That was the lesson of the Great Depression. It began in 1929 when the Hoover Administration’s tightened credit to combat inflation, and lasted until 1933 when Roosevelt instituted the modern government safety net—including social security, unemployment insurance, and the various government work projects that directly employed millions of the young and old.

    clip_image012

    The key is to find ways to unlock that demand. It makes sense that since consumers make up some 70 percent of economic activity at present, putting more money into consumers’ pockets is a must. But if in the form of tax breaks, it must flow to those in the lower income brackets, where it gets spent. Most of the tax benefits to date have gone to the upper 1 percent in the form of investor benefits—such as lower capital gains and dividends taxes—i.e., to the investor class who tend to save rather than spend most of their income.

    Another remedy is bond trader Bill Gross’s suggestion of spending more on infrastructure. California is building its first high-speed rail service with federal stimulus money. This would employ more blue-collar construction workers who have been hardest-hit by this recession.

    Also, homeownership is down from 70 percent to approximately 66 percent of households, with somewhere between 5 to 10 million of those households’ loans in danger of default, government can do more to support housing. Roosevelt during the 1930s actually took ownership of homes and rented them back to former homeowners, until they were able to buy them back. Today’s various loan modification programs are pale imitations of what was done then.

    Yet government can only do so much to stimulate growth. The private sector must step up and find ways to stimulate greater demand for its products. Madison Avenue has always found ways to stimulate both wanted and unwanted consumer needs that result in an excess of choices. With corporations once again making record profits, there is no reason for them to resist hiring more workers. Labor productivity is at record highs because corporation continue to push their existing workforce to produce more.

    That should also be the lesson of the Great Recession. Extraordinary times call for extraordinary measures.

    Harlan Green © 2010

    Posted in Uncategorized, Weekly Financial News | Tagged , , , | Leave a comment

    Housing Affordability Still at Highs

    The Mortgage Corner

    Bolstered by favorable interest rates and low house prices, housing affordability remained near its highest level nationwide for the sixth consecutive month since the series was first compiled nearly two decades ago, according to the National Association of Home Builders/Wells Fargo Housing Opportunity Index (HOI) released today. And both housing construction and new-home sales are beginning to rise again after a lull.

    The HOI indicated that 72.3 percent of all new and existing homes sold in the second quarter of 2010 were affordable to families earning the national median income of $64,400. The index for the second quarter was slightly more affordable than the previous quarter and almost equaled the record-high 72.5 percent set during the first quarter of 2009. Until 2009, the HOI rarely topped 67 percent and never reached 70 percent.

    “Homeownership is within reach of more households than it has been for almost a generation,” said NAHB Chairman Bob Jones. “Interest rates continue to hover at historic low levels, the economy is beginning to rebound and with house prices starting to stabilize, conditions are beginning to draw home buyers back into the market, which is a positive step on the path to recovery.”

    Syracuse, N.Y., was the most affordable major housing market in the country, edging out Indianapolis-Carmel, Ind., which had held the top ranking for nearly five years. In Syracuse, 97.2 percent of all homes sold were affordable to households earning the area’s median family income of $64,300.

    Housing starts also posted a modest comeback in July, rising 1.7 percent after an 8.7 percent decrease in June. The July annualized pace of 0.546 million units came in below the median forecast for 0.565 million units and is down 7.0 percent on a year-ago basis.

    clip_image002

    The July improvement was led by a 32.6 percent bounce back in multifamily starts, following a 33.3 percent drop in June, as more households become renters. The single-family component is still weighed down by inventories-declining 4.2 percent after dipping 1.7 percent in June.

    By region, the gain in starts was led by a 3.9 percent rebound in the South. Other regions declined-the Northeast, down 25.9 percent; the West, down 4.9 percent; and the Midwest, down 1.1 percent.

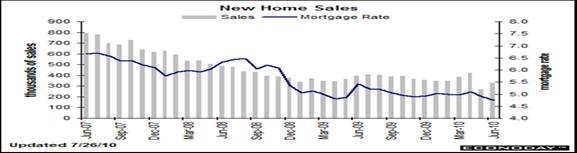
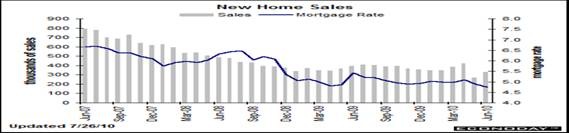
    New-home sales also recovered form recent lows. The June pace recovered to an annualized 330,000 from a revised 267,000 for May and revised 422,000 for April. While the comeback is welcome, the bad news is that May’s record drop was revised down notably from the initial estimate of a 33.0 percent decline. The latest figure is down 16.7 percent on a year-ago basis.

    clip_image004

    Monthly supply has seen sharp movement in recent months as that ratio is moved more by sales than by the number of homes on the market. Supply on the market eased somewhat to 7.6 months after surging to 9.6 in May. April had been pushed down to 6.1 months’ supply as sales bumped up to meet the signing deadline for tax credits. The median home price slipped 1.4 percent to $213,400. Year-on-year, the median price in June is down 0.6 percent. The bottom line is that the elevated inventory levels of new homes is helping keep prices low.

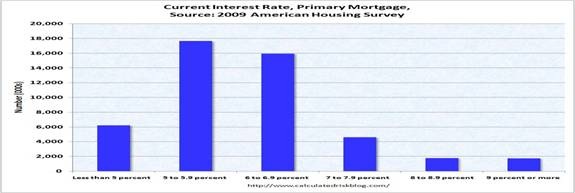
    Another interesting statistic put out by Calculated Risk is the distribution of mortgage interest among homeowners.

    A just released Census Bureau housing survey showed:

    · 76.4 million owner occupied housing units in 2009.

    · 24.2 million were owned free and clear (no mortgage). That is 31.7 percent.

    · 26.8 million primary mortgages were originated in 2004 or earlier.

    · 12.7 million primary mortgages were originated prior to 2000.

    · 24.1 million primary mortgage had interest rates above 6 percent.

    clip_image006

    This is while the 30-year conforming fixed-rate mortgage averaged 4.42 percent for the week ending Aug. 19, a record low since Freddie started tracking the rate in 1971. And, there are at least 10.9 million homeowners with 2nd mortgages and another 800 thousand the 3 or more mortgages.

    This all means that the new affordability is not available to everyone. Only 6.2 million of primary mortgages were under 5 percent (as of 2009). This will increase in 2010, but quite a few homeowners had primary mortgage interest rates above 6 percent. And the U.S Bureau of Economic Analysis recently reported that the effective rate on all mortgages was still above 6 percent in Q2.

    Harlan Green © 2010

    Posted in Weekly Financial News | Tagged , , , | Leave a comment

    What is the ‘New Normal’—Part II?

    Popular Economics Weekly

    Fed Chairman Ben Bernanke is sounding more optimistic these days. What is behind his optimism that seems to counteract the “New Normal” predictions of bond traders such as PIMCO and other fiscal conservatives who fear massive debts will hurt growth and fuel increasing inflation?  Bernanke feels that domestic economic activity is bound to pick up with a worldwide pickup, as Asia and Europe slowly recover from their malaise.

    Chairman Ben gave his most recent speech to southern legislators in South Carolina. “After a precipitous decline in late 2008 and early 2009, the U.S. economy stabilized in the middle of last year and is now expanding at a moderate pace. While the support to economic activity from stimulative fiscal policies and firms’ restocking of their inventories will diminish over time, rising demand from households and businesses should help sustain growth.”

    Third quarter Gross Domestic Growth was 2.4 percent—good but not great enough to bring down the unemployment rate, which is stuck at 9.5 percent.

    clip_image002[8]

    Domestic demand is the basic driver of growth — consumer spending, business fixed investment, housing investment, and government purchases. Real final sales to domestic purchasers rose a very positive 4.1 percent, compared to a 1.3 percent gain in the first quarter. Basically, demand by said U.S. consumers, businesses, and the government was up significantly in the second quarter.

    Bernanke highlights growing strength in the consumer sector, which powers almost 70 percent of economic growth. This showed up in an 18 percent rise in imports, mostly from consumer purchases. “In particular, in the household sector, growth in real consumer spending seems likely to pick up in coming quarters from its recent modest pace, supported by gains in income and improving credit conditions. In the business sector, investment in equipment and software has been increasing rapidly, in part as a result of the deferral of capital outlays during the downturn and the need of many businesses to replace aging equipment. At the same time, rising U.S. exports, reflecting the expansion of the global economy and the recovery of world trade, have helped foster growth in the U.S. manufacturing sector.”

    The biggest surprise was the growth in commercial and residential investments. Real nonresidential (i.e., commercial) fixed investment increased 17.0 percent in the second quarter, compared with an increase of 7.8 percent in the first. Nonresidential structures increased 5.2 percent, in contrast to a decrease of 17.8 percent. Equipment and software increased 21.9 percent, compared with an increase of 20.4 percent. Real residential fixed investment increased 27.9 percent, in contrast to a decrease of 12.3 percent.

    July total nonfarm payroll employment did not so well, declining by 131,000 and the unemployment rate was unchanged at 9.5 percent, said U.S. Bureau of Labor Statistics. This was mainly because federal government employment fell, as 143,000 temporary workers hired for the decennial census completed their work. The good news was that private-sector payroll employment edged up 71,000, seasonally adjusted. e

    clip_image004[8]

    What is now happening is that consumers are saving much more, as the Q2 preliminary savings rate shot up to 6.4 percent. This is in part due to the drop in spending, but also because consumers continue to pay down their debts.

    clip_image006[8]

    Consumer credit contracted again in June, this time by $1.3 billion. If there is good news it’s that the level of contraction is less severe than prior months. Also good news is an upward revision to May which now shows a $5.3 billion contraction vs. the initial contraction of $9.1 billion. Nonrevolving credit offers some good news, up $3.2 billion on top of May’s increase of $1.8 (revised from a $6.5 billion contraction). Solid unit vehicle sales in July point to possible gains for this component in the next report.

    All the talk about the ‘new normal’ may have a useful purpose. It is making policy makers aware of a possible need for a more comprehensive social safety net to provide for the millions who have been out work for the longest stretch since the Great Depression.

    Even stalwart Republicans, like Bush economic advisor Glenn Hubbard, believes government should boost educational opportunities for workers whose jobs are never coming back, said the New York Times. “If there is a new normal, it’s more about the labor market than G.D.P,” said Hubbard.

    And PIMCO’s Bill Gross, also a fiscal conservative, is now advocating an expanded role for government to spend tens of billions on new infrastructure projects to put people to work and stimulate demand. He said, “We think the coma will last for years unless government policy changes to restimulate the private sector and bring unemployment down”.

    Harlan Green © 2010

    Posted in Consumers, Weekly Financial News | Tagged , , , | Leave a comment

    What is the ‘New Normal’?

    Popular Economics Weekly

    There has been much talk of late about the “new normal” of slower economic growth that we may see in coming decades. It is defined by bond trader PIMCO’s Bill Gross as what he calls declining global aggregate demand—the declining demand of consumers, businesses, and government for additional good and services. We have lived through an excess of consumption and debt, and must now pay for it, in other words.

    “Developed nation consumers are maxed out because of too much debt, and developing nations don’t trust themselves to stretch their necks for the delicious leaves of domestic consumption just above,” he said in his current economic outlook.

    How true is this? He might be correct for the short term—ten million jobs have to be created to replace those lost in just the past 2 years—but not about future growth. What is true is that we will have to live with less indebtedness. But substantial growth is continuing in new industries and developing nations—Brazil, India and China are the 3 fastest growing major nations in the world.

    Consumers have been the first to pay down their debts, while businesses haven’t had to borrow much because of huge cash flows during the last decade that enabled them to finance their own operations without borrowing—and what little expansion there has been. So huge amounts of cash are sitting on the sidelines, which positions those with good ideas to expand rapidly.

    clip_image002

    Government will have to begin to size down as well, once this recovery picks up and the wars on terror have been resolved. This means consumers will be more selective in what they buy, and businesses more selective in who they hire. A recent New York Times article documented the ways industries have been able to achieve record profits (up 40 percent from late 2008 to Q1 2010), without much hiring.

    This has resulted in profits rising much faster than revenues. Among the 175 companies in the S&P 500 that have already reported earnings last quarter, reported the NY Times, revenues averaged a 6.9 percent increase, while profits rose 42.3 percent.

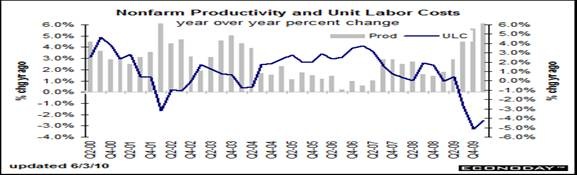
    How so? Firstly, productivity is rising faster than wages and salaries. Companies are investing more in technologies than workers, in other words. Year-on-year, productivity advanced 6.1 percent in the first quarter-up from 5.6 percent in the prior quarter. And unit labor costs—both wages and benefits—declined another 4.2 percent, compared to minus 5.1 percent the previous quarter. Output growth was a whopping 4.0 percent annualized, in other words, while hours worked barely budged up to 1.1 percent.

    clip_image004
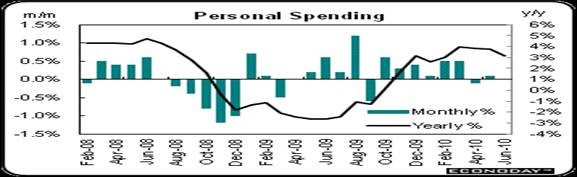
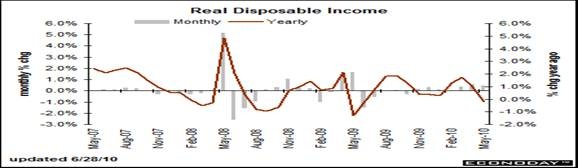
    This is while personal income growth is barely rising. It grew just 1.6 percent in May, easing from 2.6 percent in April. Inflation was mixed in May. The headline PCE price index was flat as was also the case the prior month. The core rate, however, firmed to 0.2 percent from 0.1 percent in April.

    clip_image006
    The result is a basic disparity between income brackets, with the top 10 percent of incomes rising, and the majority of wager and salary earners with no income growth at all.  This is probably the main reason for the ‘new normal’.  Something that New York Times’ columnist Bob Herbert highlighted recently. 

    A Yale study showed that more than 20 percent of Americans experienced a 25 percent or more loss in household income without any financial cushion from 1985-95, the highest in 25 years.  This is with our unemployment rate hovering around 9.7 percent. So many more than just the unemployed are suffering from the effects of the Great Recession.  But an income shift is occurring that should aid consumers, and shorten the era of falling incomes of the new normal—expiration of some of the most inequitable Bush II era tax breaks, and restoration of the taxable rates that helped to create a budget surplus during the Clinton era. 

    Harlan Green © 2010
    Posted in Consumers, Macro Economics, Weekly Financial News | Tagged , , , , | Leave a comment

    Is Pent-up Demand Growing?

    Financial FAQs

    We are now hearing that pent up demand is growing as the economic recovery takes its time. What is it, and what would it mean for an earlier recovery? Fed Chairman Bernanke mentioned that ‘demand’ could grow in a recent speech to South Carolina’s legislators.

    “While the support to economic activity from stimulative fiscal policies and firms’ restocking of their inventories will diminish over time, rising demand from households and businesses should help sustain growth…In particular, in the household sector, growth in real consumer spending seems likely to pick up in coming quarters from its recent modest pace, supported by gains in income and improving credit conditions. In the business sector, investment in equipment and software has been increasing rapidly, in part as a result of the deferral of capital outlays during the downturn and the need of many businesses to replace aging equipment.”

    Demand usually refers to aggregate demand, a key concept of Keynesian economic theory. The theory being that if consumers, businesses and governments have growing incomes/revenues, then their ‘demand’ for more goods and services will increase. Pent-up demand is comprised of the elements that must grow to stimulate aggregate demand.  This might seem obvious to anyone who has taken Economics 101, but how to measure aggregate demand is not so obvious.

    We know several factors that can stimulate demand. For instance, the 2010 Harvard Joint Housing Taskforce Study estimates that 15 million new households will be formed over the next decade, including immigrants. Yet new home growth has slowed drastically. And there are maybe 1 million surplus existing homes, due to the housing collapse. Yet even with the overhang, the demand for housing is bound to grow exponentially over the next decade.

    clip_image002

    New home sales in June actually rebounded 23.6 percent after plunging a revised 36.7 percent in May. The June pace recovered to an annualized 330,000 from a revised 267,000 for May and revised 422,000 for April. While the comeback is welcome, the bad news is that May’s record drop was revised down notably from the initial estimate of a 33.0 percent decline. The latest figure is down 16.7 percent on a year-ago basis.

    Another factor that suppresses demand is deflation. We are now in a deflationary environment, and studies show that consumers hold back from purchases if they believe prices can fall further—which creates a self-fulfilling prophecy. So rising prices will signal increasing demand.

    clip_image004

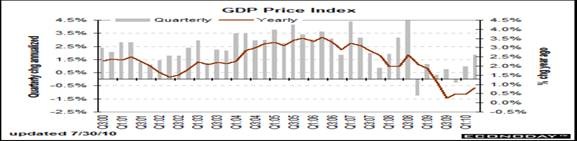
    For instance, the just released second quarter Gross Domestic Product report showed falling prices. Though economy-wide inflation accelerated in the second quarter as the GDP price index rose an annualized 1.8 percent, following a 1.0 percent in the first quarter.

    The acceleration in prices was due to the impact from higher imports—which signals greater domestic demand. But the price index for gross domestic purchases, which measures prices paid by U.S. residents, increased a bare 0.1 percent annualized in the second quarter, following a 2.1 percent boost in the first quarter. The core rate excluding food and energy prices increased just 0.9 percent in the second quarter, compared with a rise of 1.6 percent in the previous quarter.

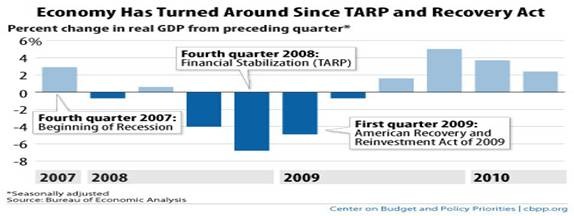
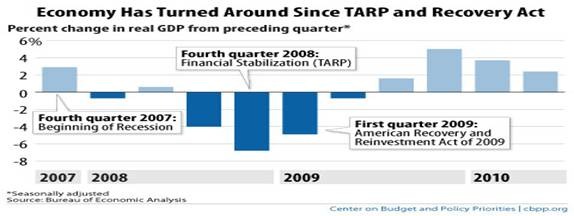
    So despite all of the doomsayers, the recovery continued in the second quarter but at a moderate pace. Yes, growth is still below par but not into a double dip, thanks mainly to the TARP and ARRA programs’ stimulus spending. Second quarter GDP came in at an annualized 2.4 percent growth, following a revised first quarter gain of 3.7 percent.

    clip_image006

    The latest quarter was led by a rebound in residential investment, a jump in investment in equipment & software, and by inventories. Personal Consumption Expenditures also posted a moderate gain along with government purchases.

    clip_image008

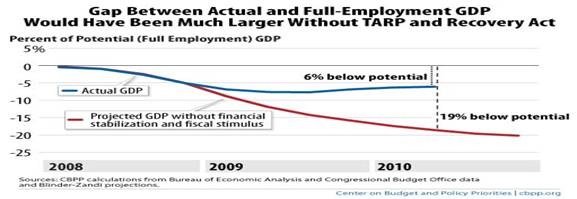
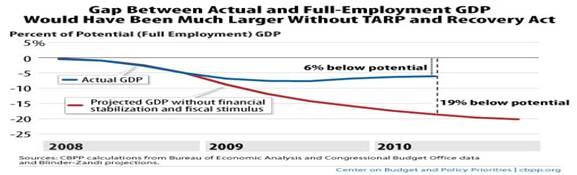
    In fact, the best measure of pent-up demand, is what is called the “output gap”.  The San Francisco Federal Reserve puts out that calculation. It was minus 6.1 percent in Q1 2009, but would have been as high as 19 percent without the TARP and ARRA stimulus spending, says the Center for Budget and Policy Priorities (CBPP), a non-partisan think tank.

    The output gap measures how far the economy is from its full employment or “potential” level that depends on supply-side factors of the economy: the supply of workers and their productivity. During a boom, economic activity may for a time rise above this potential level and the output gap is positive. During a recession, the economy drops below its potential level and the output gap is negative. In theory, the output gap can play a central role in monetary policy deliberations and strategy.

    In fact, one of the goals of the Federal Reserve is to maintain full employment, which corresponds to an output gap of zero. And it is the employment rate that best determines output, so we know that the Fed isn’t going to begin to raise interest rates, until the unemployment rate declines substantially, which means that pent-up demand will begin to kick in.

    Was Bernanke being too optimistic? We don’t think so.  Nor does the stock market, which continues to rally.

    Harlan Green © 2010
    Posted in Consumers, Keynesian economics, Macro Economics, Weekly Financial News | Tagged , , , , , , | Leave a comment

    Why Does The Fed Hesitate?

    Popular Economics Weekly

    Fed Chairman Ben Bernanke just gave his semi-annual report to Congress, and it looks like Bernanke and his Federal Reserve Governors continue to be cautious in advocating more stimulus.  He said that the Fed had more ways to add stimulus but at present no plans to implement them. That is too bad, when a consensus is building that more monetary stimulus is needed to put monies into consumers’ pockets with jobs still hard to find.

    Why have the Fed governors been so timid? It has more to do with ideology, than economic fundamentals. Since many of the Fed Governors are former bankers, they dislike debt, and the Fed has had to buy more than $2 trillion in mortgage-backed and Treasury securities to add liquidity to the system. This has kept interest rates at historic lows, but has only begun to bring real estate and job creation out of their doldrums.

    Job formation has really been increasing since January, and real estate prices have inched up, but sales remain stagnant. This is while corporations have reported record profits over the last 2 quarters with the highest profit margins since WWII, yet have not been investing in either new plants or employees. Bernanke in his latest Humphrey-Hawkins congressional testimony said that it was because corporations had too much excess capacity, (which means they see insufficient demand for their products and services).

    And so government has had to step in to counteract the cash hoarding of some $1.8 trillion being held by the S&P 500 corporations alone, to help stimulate that demand. But why such a fear of debt, when the Great Depression has provided us with a lesson of what needs to be done to counteract such fears?

    Nobel economist Paul Krugman has pulled up some of the Great Depression’s history, which shows that the Hoover Administration’s emphasis on reducing deficit spending increased debt as a percentage of GDP, while shrinking actual GDP growth (and revenues). But increased government spending (and debt) during Roosevelt’s New Deal increased economic growth; so though debt loads were high, it brought the U.S. out of the 1929-1933 depression and produced 3 years of growth. The double-dip only returned in 1937, when Roosevelt listened to the bankers and tried to reduce the deficit prematurely.

    clip_image002

    “The experience of the 30s,” writes Krugman, “offers no support to those who worry about the debt consequences of deficit spending in a depressed economy — FDR didn’t do enough stimulus, but the spending he did do was not reflected in a spiraling, or even rising, debt burden. And the evidence is consistent with the view that austerity, Hoover-style, may well be self-defeating even in a narrow fiscal sense.”

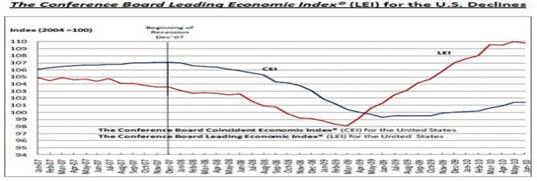
    Supporting the present picture is weak growth of the Conference Board’s Index of Leading Economic Indicators, a monthly snapshot of 12 important indicators that affect future growth, such as interest rates, and hours worked.

    “The LEI decreased in two of the last three months, but its level is still about 4.5 percent above its previous peak before the recession began,” said Ataman Ozyildirim, economist at the Conference Board. “Moreover, the gains among the LEI components have been widespread, with the exception of housing permits and stock prices, pointing to an expanding economy, but at a slower pace in the second half of the year.”

    clip_image004

    A major reason for continued sluggish growth is that real estate has still to work off more than 1 million units in excess inventory built up over the bubble years. Total units of housing inventory peaked in 2006, but months of supply didn’t peak until 2008, as the sales’ rate declined drastically during the credit crisis and failure of lending institutions such as Lehman Brothers and Bear Stearns.

    clip_image006

    This increase in inventory is especially bad news because the reported 8.9 months of supply in June is well above normal.  So there is good reason for the Fed to continue to hold interest rates at record lows, and Chairman Bernanke has continued his promise to do so for “an extended period” in his testimony. “We are ready and we will act if the economy does not continue to improve — if we don’t see the kind of improvements in the labor market that we are hoping for and expecting,” he said.

    Harlan Green © 2010
    Posted in Macro Economics, Weekly Financial News | Tagged , , , | Leave a comment

    Jobs, Jobs, and more Jobs Needed

    Financial FAQs

    Three new Federal Reserve Governors are up for confirmation that would fill out the Federal Reserve Board of Governors for the first time in years. And what are they saying? Surprise, surprise: “Fed Nominees Stress Job Creation,” was one of the headlines announcing their nomination by President Obama.

    That is surprising because the Federal Reserve has since 1980 been fighting the specter (i.e, a ghost or phantom image, per Webster) of inflation. This is even though it has a twin mandate—promote growth (and jobs) while maintaining a stable currency (read low inflation rate). The two have come in conflict in the past, as when 1980 Fed Governor Paul Volcker raised the Fed Funds rate to 18.9 percent to dry out the double-digit inflation of the 1970s, causing two successive recessions (1981 and 1982).

    And fighting inflation has had the upper hand ever since, which has resulted in the Fed raising interest rates at the drop of a hat, such as happened in 1994 that caused the Orange County bankruptcy, and job formation to suffer. The results are that job creation after the 1991 and 2001 recessions is the lowest on record.

    Stanford economist Robert Hall, Chairman of the NBER business cycle dating committee, has attempted to explain why those two so-called modern recessions differed from the past, but comes up with no conclusive answer. “The facts are perplexing,” writes Hall in a recent Stanford paper, “employment falls at least as far as in past recessions, without identifiable driving forces.”

    But Nobelist Paul Krugman has an answer in his blog. It is called demand-side (vs. supply-side) economic policies that have not been adequately utilized.

    “One vision, which is the one I subscribe to, is basically an updated Keynesian view: sticky prices revised gradually based on unemployment and excess capacity, the possibility of persistent economic malfunction because people are trying to hoard cash rather than buying real goods. And this view also said that we were and are in a liquidity trap, in which things that might have been inflationary under other conditions — like a large expansion of the monetary base — weren’t at all inflationary under current conditions. In fact, the likely outlook was for falling inflation, and possibly deflation.

    “The other vision was basically a crude quantity theory of money view: hey, the Fed is printing money, the government is running deficits, so high inflation, maybe even hyperinflation, is staring us in the face.”

    “Sticky prices” refers to the theory that prices are slow to adjust downward during recessions. But that doesn’t mean that disinflationary, or even deflationary forces are not at work. And once they do begin to adjust downward in a sustained way, watch out. Profits and then wages are sure follow, resulting in a downward spiral of incomes and jobs.

    “The past year has, in effect, been a fairly clean test of these two views,” says Krugman. “And what has happened has been very much what people like me said would happen: in the face of persistent high unemployment, inflation has fallen despite all that money creation, and interest rates have stayed low despite those budget deficits. If you bet on inflation and rising rates — which, by the way, Eric Cantor, the Republican House whip, did — you lost a lot of money.”

    Yet in spite of this history, the Fed is still reluctant to add more stimulus to monetary policy. It has stopped buying mortgage backed securities (though interest rates are still at record lows) in a bid to boost real estate, and stated it is basically standing pat on monetary policy in its latest FOMC meeting.

    Krugman thinks this is wrong-headed thinking. The latest Federal Reserve growth projections see core PCE inflation rising 1.2 to 1.6 percent through 2010, well within its stated target range of 1-2 percent. “I have no idea why Fed presidents expect core inflation to rise over the next two years,” he said. “Historically, high unemployment has been associated with falling, not rising inflation. In fact, my bet is that we will be near or into deflation by 2012. But even given the Fed’s own projections, it’s not doing its job, it’s missing its targets. Yet it apparently sees no need to act.”

    Hence the Obama Federal Reserve appointees emphasis on job creation, rather than fighting inflation. The inflation numbers bear this out. We are approaching the danger zone of deflation, resulting in a vicious downward spiral of prices with stagnant growth, or stagdeflation, if you will.

    clip_image002

    Lower energy costs tugged down on the consumer price index in June, resulting in a third consecutive decline in the headline number. In June overall CPI inflation dipped 0.1 percent, following a 0.2 percent decline in May. The latest month matched the market projection for a 0.1 percent decline. Excluding food and energy, the CPI edged up to 0.2 percent after a 0.1 percent uptick in May.

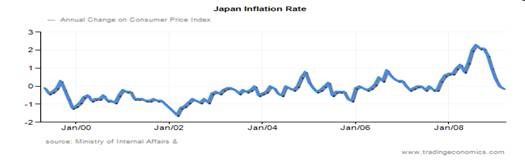
    Why the probability of deflation, when the economy seems to be recovering, with GDP growth positive over the last 3 quarters? The Japanese experience of deflation for 2 decades that set back their economic growth (and position in the world) is the best example. It portrayed the classic liquidity trap. No matter how much money was created by its central bank, investors and consumers refused to spend it. And so once the deflationary spiral downward began, it took decades to arrest. Their central bank did not react quickly enough to the bursting of both stock market and real estate bubbles that had reached record highs in 1990-01.

    clip_image004

    The problem by Japanese economist Richard Koo is that this is a ‘balance sheet’ recession. I.e., so much U.S. debt was piled up in the last decade with 2 wars and tax cuts to pay for, that both consumers and government must bring their balance sheets back into balance before what is called aggregate demand increases substantially.

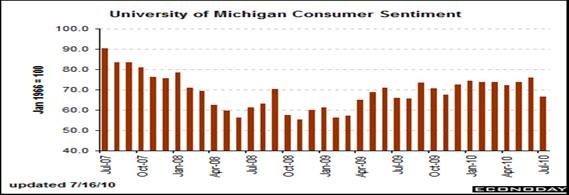
    The U. of Michigan had a record plunge in its sentiment survey, as if to emphasize the precariousness of consumers’ balance sheets. The economic recovery is slowing and consumer spirits are falling. Consumer sentiment literally plunged in the mid-July reading, down nearly 10 points to a 66.5 reading that pushes this index back to the lows of last year. Both the expectations and current-conditions components show roughly 10 point drops.

    clip_image006

    Even the minutes to the Federal Reserve’s last FOMC meeting emphasized the fragility of this recover. Fed officials noted that “the committee would need to consider whether further policy stimulus might become appropriate if the outlook were to worsen appreciably,” according to the minutes. So emphasizing jobs formation is a must for the Fed’s monetary policy.

    Harlan Green © 2010
    Posted in Keynesian economics, Macro Economics, Weekly Financial News | Tagged , , , , | Leave a comment