Where is Harry Truman—Part II?

Popular Economics Weekly

What is the case for not providing more additional stimulus spending to boost economic growth? Harvard Econ Prof Gregory Mankiw, former Bush White House economic advisor, gave this rather bizarre prediction for the future behavior of employers on his Blog. It seems that more stimulus spending creates more debt, ergo raises the prospect of higher taxes.

So, “businesses may be reluctant to invest in an economy that they expect to be distorted by historically unprecedented levels of taxation in the future,” he says.  “The more the government borrows, the higher taxes will need to go, the more distorted the future economy will be, and the less attractive is investment today.”

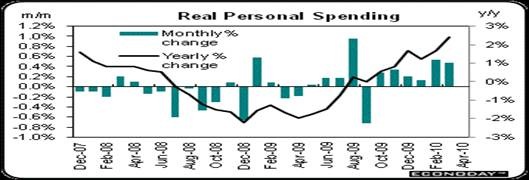
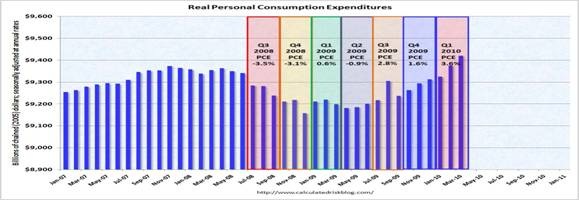
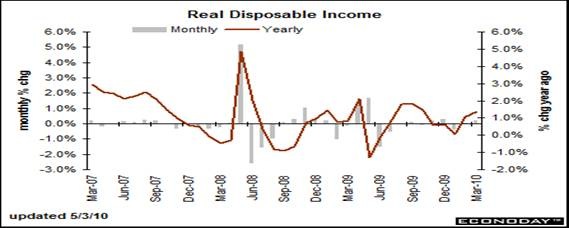
Yes, it is true that debt levels figure into both investment and spending decisions, but no one has been able to quantify how much. Consumers, for instance, are still paying down debt in record amounts. So much so that the personal savings rate has risen to 4 percent, from zero in the past decade. But consumer spending has also ramped up to almost 4 percent, which means incomes are increasing. Therefore, it doesn’t look like anyone is yet worried about higher future taxes.
clip_image002

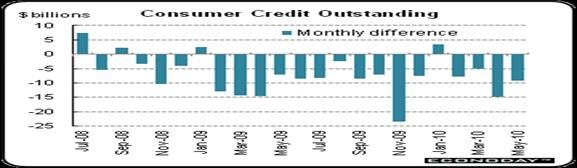
Consumer credit contracted a sharp $9.1 billion in May with April revised to show an even more severe $14.9 billion contraction, as we said last week. Revolving credit contracted $7.4 billion and contracted $8.3 billion in April. Non-revolving credit shows a $1.8 billion contraction in May on top of a $6.5 billion contraction in April. Neither category is likely to show much improvement in June given indications from retail sales and last week’s soft unit vehicle sales.

So, what’s going on—are consumers retrenching?  That might be part of the story.  Outstanding consumer credit can decline either due to consumers paying balances down or because banks and finance companies are charging off bad credit. But the charge offs are actually a positive for consumer spending—more discretionary income is freed.  The big picture is that the consumer is still cautious, says Econoday.

So why would such a reputable economist as Dr. Mankiw advance an unproved hypothesis? Some of it has to do with discredited economic theories that say our economy is a zero-sum game. When the government spends money, it takes away investment from the private sector. Households seem to operate that way, for instance. There is only so much money to go around, right?

But what happens when businesses hoard their cash, as they are doing now? The $1.8 trillion being held by the S&P 500 largest corporations are not being used—either in R&D that would create future products and services, studies show, or increasing their production capacity.

And so economic activity stagnates. Money sits at basically zero interest, earning zero returns—unless government steps in to borrow that money to directly create jobs, as it has been doing in green technologies, or to retain jobs with infrastructure investments.

That is the real debate. Conservatives want government to shrink spending, in order to shrink the amount of debt. This is because too much debt devalues the debts of creditors, which mostly reside on Wall Street. Whereas Keynesian economists believe in stimulating demand by putting more money into consumers’ hands that will stimulate more revenues going into the coffers of both government and private industry.
clip_image004

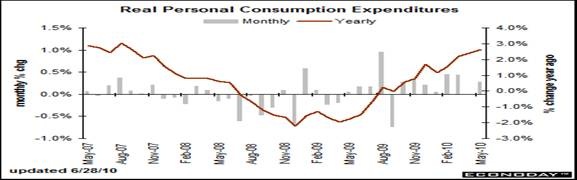
Year on year, personal income growth for May posted at 1.6 percent, easing from 2.6 percent in April. It became positive again in July 2009, at the end of the Great Recession. Year-ago headline PCE inflation edged down to 1.9 percent from 2.0 percent. Year-ago core PCE inflation firmed down to 1.3 percent from 1.2 percent in April. Falling prices might be the reason consumers remain cautious buyers.

But overall, the consumer sector is slowly gaining strength in terms of spending power, thanks in large part to government stimulus programs. Purchases have been a little erratic due to off and on auto and home buying incentives. But the consumer sector took one step forward in May, helping the recovery continue.

So what is the lesson from “give ‘em hell, Harry” that we asked last week? Econ Professor and columnist Paul Krugman thinks most who oppose government stimulus oppose government in general. President Truman believed in the New Deal, and the need for government support during tough economic times.

Those who worry about too much debt are worrying about the wrong debt. Stimulus spending creates short term debt that will come down when economic activity picks up. But longer term debt that will be carried by future generations comes from entitlements like social security and Medicare, which are projected to grow exponentially with retiring baby boomers. How to pay for those entitlements is a decision which should be faced by the present generation, rather than passed on to their children and grandchildren.

Harlan Green © 2010
Posted in Consumers, Keynesian economics, Weekly Financial News | Tagged , , , , , | Leave a comment

Housing Affordability Still Improving

The Mortgage Corner

A very pessimistic Harvard University Joint Center for Housing Studies’ 2010 annual report says with the job market in dire straits, household incomes declining and foreclosures dragging down home values, the housing market may take years to recover. But the Harvard study is already outdated. Affordability is much better in 2010, and jobs and incomes have improved substantially.

The Harvard study says affordability is still a problem because household incomes have been falling; though not as much as housing prices. Calculate in record low interest rates that are forecasted to last at least through 2011, and we see that affordability is in fact very high. The good news is that prices have fallen up to 50 percent in some regions since 2008, while household median income has fallen about 6 percent.

“Very low mortgage interest rates and recovering labor markets, however, should be enough to shore up sales and housing starts once an expected dip due to the expiration of the federal homebuyer tax credit passes. “If history is a guide, what happens with jobs will matter the most to the strength of the housing rebound,” says Eric S. Belsky, Executive Director of the Joint Center for Housing Studies. “Right now, economists expect the unemployment rate to stay high, but if employment growth surprises on the upside or downside, housing numbers could too.”

In fact, the National Association of Realtors (NAR) reports that the median existing-home price has actually risen 6 percent in 2010, while the median household income is hovering around $60,500. This has kept the NAR’s affordability index at 167 percent—a family with a median income can afford 167 percent of a median priced home. Whereas, it was as low as 115 percent in 2005 when housing prices were in bubble territory (and interest rates were 1.5 percent higher).

Consumers are paying down their debts, in part because of high mortgage debt levels. The year-over-year debt to household income measure that includes mortgage debt has fallen from 23.5 to 21.5 percent, while total outstanding credit is still contracting at slightly less then 4 percent per year, as we said last week.

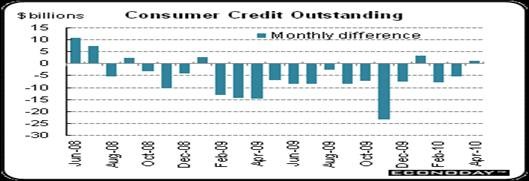
Consumer credit rose $1.0 billion in April in a gain far offset by a $7.4 billion downward revision to March which now shows a $5.4 billion contraction. Non-revolving credit, reflecting strong car sales, jumped $9.4 billion in April but was offset by a nearly as large of a fall in revolving credit. The drop in revolving credit reflects consumers’ reluctance to buy non-essential items.

.

clip_image002

What were consumers buying in May? Gasoline led the way because of higher gas prices, but the trend in overall sales is upward and healthy—in spite of the May decline.  Overall retail sales on a year-ago basis in May came in at 6.9 percent compared to 9.0 percent the month before.  Excluding motor vehicles, the year-on-year rate slipped to 6.1 percent from 7.8 percent in April. 

clip_image004

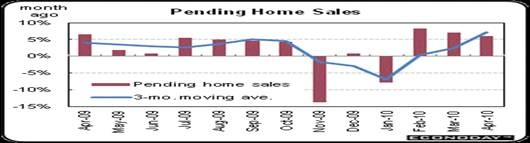
The other pleasant surprise was the continued rise in pending home sales. Already, February and March had spiked with help from last minute buyers wanting to ensure time to close before May 1. But apparently, many buyers decided to push their luck and buy during April in hopes of expedited paperwork by mortgage lenders. Pending home sales extended their surge through April, jumping 6.0 percent, following a 7.1 percent spike in March.  Year-on-year, pending home sales are up 22.4 percent.

clip_image006

The Harvard study seemed to concentrate on the bad news—an estimated one in seven homeowners has a home worth less than they owe on their mortgage, and 5 million need their home price to rebound by 25 percent before they are again above water. But there are more than 45 million outstanding home loans, and the inventory excess is in fact making home ownership more affordable—for those who can afford to buy.

Harlan Green © 2010

Posted in Consumers, Weekly Financial News | Tagged , , , | Leave a comment

Economic Interdependence Is Good

How interdependent we have become! The lessons of this recession and the ongoing recovery, is that going it alone won’t work—whether when drilling oil wells, or evading financial regulations. We even have to thank our dependence on foreign trade with Asia, and our government-aided auto industry, for what is leading this recovery—the manufacturing sector.

Economic interdependence is becoming the norm in this decade—private industry (via innovation) and governments (via regulation) are becoming more interdependent. One can no longer exist without the other. And what affects one sector now affects the overall economy.

The bursting housing bubble almost caused the worldwide collapse of the financial system because financial markets are now interconnected. The BP Gulf oil disaster is an example of nature’s interconnectedness. A toxic spill has become toxic to all states in the Gulf region.

Overall industrial production in May surged 1.2 percent, following a 0.7 percent boost the month before. The latest number was stronger than the consensus forecast for 1.0 percent. Manufacturing has been robust over the last three months with this component gaining 0.9 percent in the two latest months and jumping 1.2 percent in March.

clip_image002

A jump in motor vehicle production also added significantly to May’s overall production boost. Motor vehicle production jumped 5.5 percent, following a 1.4 percent dip in April. Nonetheless, gains were widespread in other industries, with business equipment up 1.3 percent, and consumer goods up 1.2 percent. Industrial production improved to 7.6 percent from 5.2 percent in April on a year-over-year basis.

The housing bubble has been a leading lesson in the recognition that housing is closely connected with other sectors; such as insurance, construction and finance.

And the construction industry is beginning to recover, a good sign for real estate. Expiring special tax credits for homebuyers and the recent surge in home sales have carried over to unexpected strength in construction activity. Apparently, this has cut into new home inventories enough to give homebuilders confidence to bump up the pace of new construction. However, gains are coming off low levels.

clip_image004

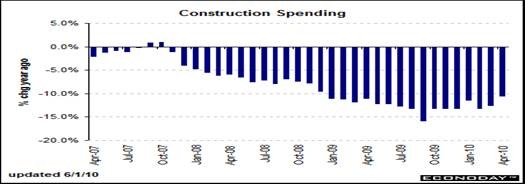
Construction outlays in April surged 2.7 percent, following a 0.4 percent rebound the month before, and rose to minus 10.5 percent in April from minus 12.5 percent in March, year-over-year. The April boost was led by a jump in private residential outlays which gained 4.4 percent after no change the prior month. Public outlays increased 2.4 percent in the latest month while private nonresidential construction rebounded 1.7 percent.

Lastly, and not so obvious, was the housing bubble’s effect on consumer confidence. It was probably a cascade effect—housing burst, then credit, which stopped both consumers and investors from borrowing. This resulted in the greatest credit contraction since WWII and the Great Depression that has now lasted 20 months.

clip_image006

Consumers appear to be focusing specifically on the health of the U.S. economy—shrugging off sovereign debt worries in Europe and the recent drop in stocks.  The Reuters/University of Michigan Consumer Sentiment Index rose to 75.5 in the mid-June reading versus 73.6 for the final reading of May. The nearly two-point gain was sizable and put the index at its best level since the January 2008 figure of 78.4.

There is a pent-up demand for housing. The Harvard Joint Housing study estimates 15 million new households will be formed in this decade 2010-2020. But there is uncertainty whether more will rent than own. Home ownership could also be a casualty of the housing bust, in other words. But that won’t hurt construction, as the latest housing starts numbers showed a big jump in rental construction (33 percent) vs. a 10 percent drop in single family housing starts.

Harlan Green © 2010

Posted in Macro Economics, Weekly Financial News | Tagged , , , | Leave a comment

May Employment Shows Sustainable Recovery

Popular Economics Weekly

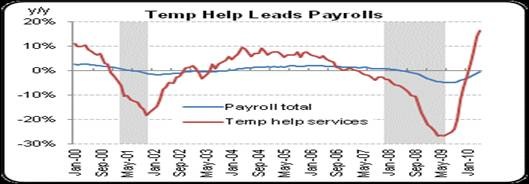
The headline number for payrolls in May was disappointing, according to the media, because of anemic growth in the private sector. But in fact it is leading to a more sustainable recovery. Most were temp help workers hired for the U.S. Census, but this will lead to more permanent jobs as overall production continues to increase. Overall payroll jobs in May surged 431,000, following a 290,000 boost in April, and a 208,000 gain in March.

clip_image002

The positive news in the payroll survey was in earnings, the workweek, and production hours. Wages picked up with a 0.3 percent rise in May, following a 0.1 percent advance the month before. The average workweek for all workers edged up to 34.2 hours from 34.1 hours in April. Production hours overall advanced 0.3 percent in May after a 0.4 percent rise the month before. For manufacturing, the improvement was even more notable with a 1.1 percent jump after a 0.8 percent gain in April.

clip_image004

Year-on-year, labor productivity has soared, the 6.1 percent increase in the first quarter-up from 5.6 percent in the prior quarter, which means very healthy economic growth with almost no inflation worries. It is a major gauge of future inflation because wage costs, which account for two-thirds of product costs, are barely rising.

clip_image006

Manufacturing hiring is also robust. Growth in new orders and employment highlighted another very strong ISM manufacturing report in May. New orders held steady at 65.7, a reading well over breakeven 50 and the third in a row over 60. Employment index was last above 60 back in May in 2004. May’s reading came in at 59.8 for a 1.3 point gain to indicate significant acceleration in hiring.

In a sign that employers are hiring more permanent workers, the number of persons employed part time for economic reasons (some-times referred to as involuntary part-time workers) declined by 343,000 in May to 8.8 million. These individuals were working part time because their hours had been cut back or because they were unable to find a full-time job. This decline was more good news. The all time record of 9.24 million was set in October.

clip_image008

The unemployment rate decreased to 9.7 percent, and the lower number of part time workers (for economic reasons) helped to push down the total unemployed U-6 labor category to 16.6 percent (from 17.1 percent), which is still a large number.

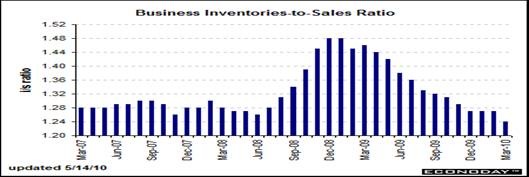
But the ultimate sign of a sustained recovery is a declining inventories-to-sales ratio, which signals that pent-up demand is growing; which is why production is growing, employers are hiring again.

clip_image010

And key sectors of the economy are lining up together in what hopefully will be a sustained cycle of inventory replenishment. Business inventories rose 0.4 percent in March on top of a 0.5 percent gain in February and a smaller gain in January. In what is especially good news, its components show nearly uniform increases in March: manufacturers up 0.3 percent, retailers up 0.4 percent, wholesalers up 0.4 percent. In fact, we are already in a sustainable recovery.

Harlan Green © 2010

Posted in Consumers, Weekly Financial News | Tagged , , , | Leave a comment

Consumers Financial Health Improving

Popular Economics Weekly


Consumers’ financial health continues to improve. They are managing to both save and spend more, in spite of worries about both federal and state deficits. In fact, deficits don’t seem to matter to consumers, at least, as the latest consumer sentiment surveys show consumers’ spirits improving with better job prospects and increasing income.

A little known economic indicator—the Federal Reserve’s monthly report on consumer credit (i.e, outstanding revolving and installment debt, but not mortgages)—shows that consumers are still paying down their credit card debt, but borrowing money for larger loans, like auto and appliances that require a standard monthly payment.

clip_image002

The year-over-year debt to household income measure has fallen from 23.5 to 21.5 percent, while total outstanding credit is still contracting at slightly less then 4 percent per year. Consumer credit rose $1.0 billion in April in a gain far offset by a $7.4 billion downward revision to March which now shows a $5.4 billion contraction. Non-revolving credit, reflecting strong car sales, jumped $9.4 billion in April but was offset by a nearly as large of a fall in revolving credit.

clip_image004

Though retail slowed in May, thanks to a huge drop in building supplies and materials, consumer sentiment rose to 75.5 in the mid-June reading vs. 73.6 at month-end May. The nearly two-point gain is sizable and puts the index at its best level of the year. Gains were posted for both the expectations and current conditions components. Another plus is a definitive fading in inflation expectations, falling an unusually steep 5 tenths in the 12-month outlook to 2.7 percent. Today’s report, because of its strength, hints at underlying improvement in the jobs market and should offset the sting from the May retail sales report.

clip_image006

Higher vehicle sales were a pleasant surprise that reinforces strong overall retail sales. Car and truck sales proved very solid in May, at an annual adjusted rate of 11.6 million surpassing April’s 11.2 million and ranking alongside March’s incentive-driven spike of 11.8 million. Strength was centered in domestic-made trucks which jumped 8.6 percent to a 5.1 million unit pace.

The other pleasant surprise was the continued rise in pending home sales. Already, February and March had spiked with help from last minute buyers wanting to ensure time to close before May 1. But apparently, many buyers decided to push their luck and buy during April in hopes of expedited paperwork by mortgage lenders. Pending home sales extended their surge through April, jumping 6.0 percent, following a 7.1 percent spike in March.  Year-on-year, pending home sales are up 22.4 percent.

clip_image008

Harlan Green © 2010

Posted in Consumers, Weekly Financial News | Tagged , , , | Leave a comment

The Great Stimulus Debate

Financial FAQs

It is called the Great Debate, because it began during the Great Depression. Should government stimulus be used to bring an economy out of recession-depression? Or, should private business play it out, and the weakest fall while the strongest survive to start anew?

A 25 percent jobless rate and closing of 9,000 banks during the decade of the Great Depression was horrific, and the reason no one wants a repeat performance. That is why President Obama pushed for ARRA, the American Reinvestment and Recovery Act. And it succeeded in stopping what could have been a second Depression.

Christina Romer, Obama’s chief economist and an economic historian of the Great Depression, told us why it was so important at a recent William and Mary College graduation. “The economic situation facing the new Administration was unlike any we had seen since the Depression. In January 2009, the economy was losing more than three-quarters of a million jobs per month. Output was plummeting and businesses were closing their doors at an alarming rate. The financial system was seized with fear and key flows of credit, the lifeblood of our economy, virtually evaporated. Though not a depression, this truly was a Great Recession.”

It is interesting who has taken sides on this debate—a debate really between the haves and have nots. Creditors—mainly banks and other holders of debts—don’t want their debts devalued, so they advocate letting the weak fall, which can cause deflation and so enhance the value of debt. The debtors on the other hand, want any stimulus they can get to ward off failure and preserve what equity they have left.

So demand and prices fall, and businesses cut back on production and jobs—unless government steps in. The signature trait of a serious recession is some form of hoarding—by consumers who stop spending to pay down their debts, and investors seeking safe investment havens like U.S. Treasury securities.

“The signature action to fight the recession was the American Recovery and Reinvestment Act. This was simply the boldest countercyclical fiscal stimulus in American history,” said Dr. Romer. “It was unquestionably bolder than the fiscal actions pursued in the New Deal. The Recovery Act included tax cuts and expenditures equal to more than 4 percent of GDP spread over two years. At its largest, the fiscal expansion under Roosevelt was just 1½ percent of GDP. And, that did not occur until the Depression had been going on for six years, and it was counteracted by an equally large fiscal (i.e., spending) contraction the very next year.”

The Congressional Budget office has estimated that up to 3.7 million jobs will be saved or created as a direct result of ARRA, and more as a result of the Federal Reserve holding down interest rates that stopped real estate prices from falling further. This is a veritable drop in the bucket compared to the estimated $4-5 trillion in lost output during this recession that cost 8 million jobs.

clip_image002

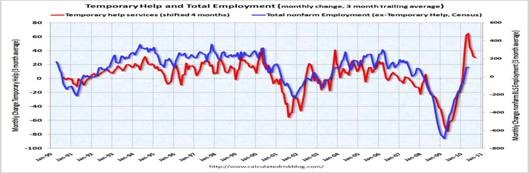
Despite the disappointing headline number for payroll jobs (just 41,000 of the 413,000 jobs created were non-governmental), there actually was some favorable news.  The gains in temps and workweek point to future hiring.  Personal income should be strong for May.  The aggregate hours jump for manufacturing suggests a robust increase in industrial production for the month.  Yes, the underlying trend in jobs is less than hoped, but recovery is still underway.  And we are getting some “fiscal stimulus” from the Census hires, says Econoday.

clip_image004

Construction spending also improved after a winter slump. The April boost was led by a jump in private residential outlays which gained 4.4 percent after no change the prior month.  Public outlays increased 2.4 percent in the latest month while private nonresidential construction also rebounded 1.7 percent after a sustained drop.

clip_image006

Another positive economic indicator was that car and truck sales proved very solid in May, at an annual adjusted rate of 11.6 million surpassing April’s 11.2 million and ranking alongside March’s incentive-driven spike of 11.8 million. Strength was centered in domestic-made trucks which jumped 8.6 percent to a 5.1 million unit pace. Why is the jump in truck sales important? Because trucks are used by businesses, which points to more economic activity!

So the recovery is not so sluggish, considering the obstacles it still faces with the $1 trillion drain of 2 wars being fought and Wall Street still looking for ways to evade regulation.  Spending and production are running ahead of jobs numbers.  These point to continued moderate improvement in the recovery—and a recession that is certain to be shorter than the Great Depression.

Harlan Green © 2010

Posted in Macro Economics, Weekly Financial News | Tagged , , , , , | Leave a comment

The Debt Fallacy

Financial FAQs

The European debt crisis has re-triggered the debate over budget deficits, and even whether Europe’s problems could trigger a ‘double-dip’ return to recession in our own economy. The contention is that Europe will be burdened with debt for years to come, which slows their economic growth.

What has Europe to do with our own economy? It is mainly the relationship between currencies. When the euro is high, then our exports are cheaper, helping manufacturing employment in particular. So the reverse case boosts European exports and reduces ours. And the euro’s value has plunged as investors fled to dollar denominated investments.

But a more general debate is whether governments should incur additional debts to cure such financial crises as we are now weathering. So-called Keynesian economists say that government stimulus spending is crucial to any recovery, since it boosts demand for new products and services. But that only happens if it is directed to consumers—who account for up to 70 percent of economic activity.

So-called supply-side policies boost the producers by giving tax cuts directly to investors and businesses, in the hopes that it will induce businesses to expand and create more jobs. However that didn’t happen during the last recovery. The 5 million jobs created from 2000-08 was the lowest total since WWII.

Nobelist and columnist Paul Krugman came up with an interesting conclusion on just that subject. Were we better off under the supply-side policies of President Reagan in the 1980s who wanted to funnel more money to the supply-side, or of Clinton in the 1990s who wanted it to go to consumers, was his question.

“Here’s what I think,” said Krugman, “inflation did have to be brought down — and Paul Volcker, not Reagan, did what was necessary. But the rest — slashing taxes on the rich, breaking the unions, letting inflation erode the minimum wage — wasn’t necessary at all. We could have gone on with a more progressive tax system, a stronger labor movement, and so on.”

Our debt-incurred stimulus spending is definitely working. The Congressional Budget Office reported the latest results of the $787 billion American Recovery and Reinvestment Act (ARRA) under this headline:

New CBO Report Finds ARRA has Preserved or Created up to 2.8 Million Jobs

While the report focuses primarily on the first quarter of 2010, CBO also includes new projections of the Recovery Act’s jobs impact through 2012. It finds that in the current quarter (the second quarter of 2010), there are 1.4 million to 3.4 million more jobs in the economy because of ARRA, and it predicts that ARRA’s jobs impact will peak this fall, when there will be 1.4 million to 3.7 million more jobs because of the legislation.

This is in line with the latest unemployment report, which showed 290,000 payroll jobs created in April, following a revised 230,000 advance in March, and 39,000 rise in February. April’s boost topped the market estimate for a 200,000 gain. Net

combined revisions for March and February were up a 121,000-including turning February from negative to positive. But the key number is private payrolls as Census hiring added 66,000 to April’s jobs, compared to adding 48,000 the prior month. Private nonfarm employment increased 231,000, following a 174,000 rise in March.

clip_image002

The real key to refuting the ‘debt fallacy’ is the benefit government stimulus does for consumers’ pocketbooks, and that is also looking better. Consumers are getting healthier— at least financially, as income gains enable them to spend and save more, with inflation almost non-existent. The headline PCE price index was unchanged in April-easing from up 0.1 percent in March. The core rate also was soft, gaining only 0.1 percent and matching both March and the consensus forecast.

clip_image004

Personal income posted a solid 0.4 percent increase for April, matching the gain the month before. The April figure came in slightly lower than the market forecast for a 0.5 percent boost. Importantly, the latest increase is in what really counts as the wages & salaries component advanced 0.4 percent after rising 0.3 percent in March.

The good news is that consumers are finding more greenbacks in their wallets and this should support additional spending and the recovery. The consumer on average is now pulling its weight in the recovery, while inflation remains benign.

What about paying back the $11 trillion in public debt? We can follow the post-WW II scenario, when it was 120 percent of GDP. That debt was paid down to its lowest level by 1980 in the post-war recovery. Today it is approaching 90 percent of GDP, because this was the worst downturn since the Great Depression. So once again the key to a recovery is keeping consumers healthy, which leads to more jobs and higher incomes.

clip_image006

Among ARRA’s most effective provisions for saving and creating jobs, according to CBO’s estimates, are direct purchases of goods and services by the federal government, transfer payments to states (such as extra Medicaid funding), and transfer payments to individuals (such as increased food stamp benefits and additional weeks of unemployment benefits). CBO’s estimates indicate that tax cuts are less effective job producers, and tax cuts for higher-income people and corporations have very low bang for the buck.

Harlan Green © 2010
Posted in Uncategorized | Tagged , , , , , , , | Leave a comment

Is Risk a 4-letter Word?

Financial FAQs

Barron’s columnist Alan Abelson asked just that question this week after the general decline in stocks, and 900 plus point drop in the DOW. Have investors become so cautious because of Europe’s debt problems and the uncertainty of our recovery that they no longer are willing to invest in this recovery? Banks are holding record amounts of deposits because investors are investing little and consumers spending less.

Actually risk comes from the French risqué, to be daring, according to Larousse—so that nothing ‘risqué’ is nothing gained. In fact, the French expression for Dare-devil is Risque-tout (or being totally risqué).

So being risqué is taking a chance in a dare-devil way. Hence periodically wild gyrations in stock prices should come as no surprise—at least to those in for the long haul, like marching towards retirement. Risk = both the potential for gains and losses, but any uncertainty lowers the tolerance for risk.

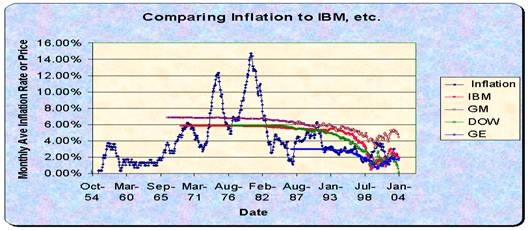
The good news is that stock prices do behave according to certain parameters. One such is inflation. To paraphrase Milton Friedman’s dictum that inflation is always and everywhere a monetary phenomenon, economists generally maintain stock (and bond) prices are always and everywhere inversely related to inflation. Robert Thibadeau is one such economist. His historical graph of stock prices vs. inflation shows that stock prices tend to fall with high inflation, as happened in the 1980s, and rise with low inflation, as happened after 1998.

clip_image002

So it is good news that inflation has fallen in past months. Economist Paul Krugman fears it could fall further, however, which might give us something like Japan’s so-called ‘lost decade’ of no growth. But stock prices have been rising in this low inflation environment, which might counteract that tendency to slower growth.

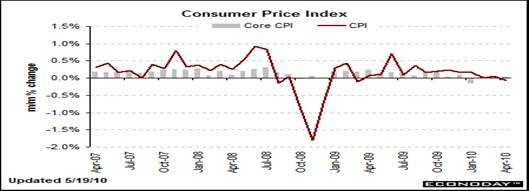
In April, overall CPI inflation dipped 0.1 percent after edging up to 0.1 percent the month before. Core CPI inflation was flat for two months in a row. Year-on-year, overall CPI inflation eased to 2.2 percent (seasonally adjusted) from 2.4 percent in March. The core rate slipped in April to 1.0 percent from 1.2 percent the prior month.

clip_image004

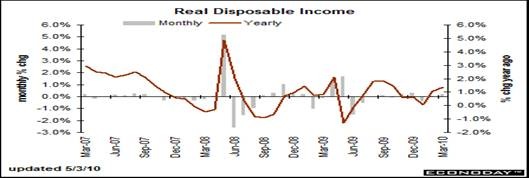
One may argue with the CPI, but the Fed also looks at the Personal Consumption Expenditure deflator, which measures overall prices. And even though year on year, personal income growth for March rose to 3.0 percent, rising from 2.2 percent in February, annual headline PCE inflation in March is 2.0 percent, while annual core PCE inflation was steady at 1.3 percent. This has helped to increase real, after inflation, disposable income.

clip_image006

So the combination of lower inflation and higher personal incomes should keep consumers spending and stocks rallying that will prevent a ‘double-dip’ recession. Recessions are always and everywhere a deflationary phenomenon. I.e., prices fall because of a fall in demand, which means a slack economy, which leads to higher unemployment. But why do stocks tend to rally with low inflation? It is a sign that investors appetite for risk is returning, in anticipation of a recovery.

clip_image008

And the latest signs are that investors are again investing and consumers spending. This is the major reason stocks have recovered. And as we reported last week, based on analysts’ 2010 earnings estimate, the ‘forward’ price-to-earnings ratio of the S&P 500 has slipped to 13.7 percent from 15.3 percent less than one month ago, below the historical 100-year average for stock prices—another reason to be daring.

Harlan Green © 2010

 
Posted in Macro Economics, Weekly Financial News | Tagged , , , , , , | Leave a comment

No More ‘Double-Dip’ Talk

Popular Economics Weekly

“Irrational Exuberance” author Robert Shiller in an eye-opening Sunday NYTimes op-ed maintains there is still chance of a double-dip recession. But it could happen over years, rather than months. “I use the definition of a double-dip recession that doesn’t emphasize the short term,” he says. “I see it as beginning with a recession in which unemployment rises to a high level and then falls at a disappointingly slow rate.”

The problem with such a definition is that only the Great Depression fits his description. The double-dip occurred in 1937, 4 years after the 1929-1933 depression, when most economists say President Roosevelt prematurely attempted to balance his budget! So is Professor Shiller guilty of his own irrational pessimism?

There is little likelihood of a double-dip for several reasons. Hiring is picking up in the wake of record corporate profits over the past 2 quarters, the huge amount of stimulus spending—some $3 trillion plus is just now taking effect and, confidence levels are not falling in spite of the current stock market correction.

clip_image002

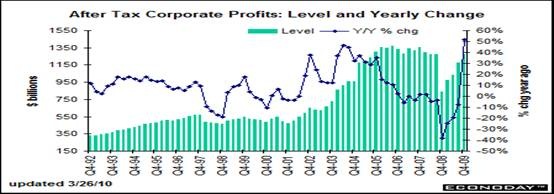
Corporate profits in the fourth quarter surged to an annualized $1.270 trillion from $1.174 trillion the prior quarter, as we reported last week. Profits in the fourth quarter were up an annualized 37.0 percent, following a 68.0 percent jump the prior quarter. Profits are after tax but without inventory valuation and capital consumption adjustments. Corporate profits are up 51.8 percent on a year-on-year basis.

This is the major reason stocks have recovered. The New York Times’ Paul Lim says there are rising expectations for corporate profits among Wall Street analysts (i.e., their ‘animal spirits’ are rising, not falling). So based on their 2010 earnings estimate, the ‘forward’ price-to-earnings ratio of the S&P 500 has slipped to 13.7 percent from 15.3 percent less than one month ago. And Dr. Shiller maintains in his book, Irrational Exuberance, a price-to-earnings ratio of 13-14 percent increases the odds 15 percent that stock prices will increase rather than decrease.

It is true unemployment has remained high compared to past recessions, as we said last week. But payroll jobs in April grew a healthy 290,000, following a revised 230,000 advance in March, and 39,000 rise in February.  And net combined revisions for March and February were up a 121,000—including turning February from negative to

positive.  Do we have to repeat the fact that payrolls have risen for four consecutive months and in five of the last six?  April’s boost was the largest in four years, by the way.

clip_image004

It’s hard to argue that we are still in recession with this string of gains, as we have said, even though the gains are mostly on Wall Street to date, with corporate profits soaring. Of course consumers don’t yet feel they are sharing in it, which is the basis for Shiller’s pessimism.

“From 2007 to 2009, there was widespread concern about the risk of an economic depression, but that scare has been abating”, he continues. “Since mid-2009, it has been replaced by the milder worry of a double-dip recession, as a count of Web searches for those terms on Google Insights suggests. And with that depression scare still fresh in our minds, sensitivity to the possibility of another downturn remains high.”

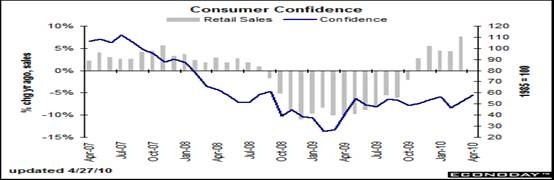
The Conference Board’s consumer confidence report rose strongly for a second straight month, up about 5-1/2 points in April to 57.9. The gain is centered in expectations which jumped 7 points to 77.4, reflecting rising optimism over the outlook for business conditions and easing pessimism on the outlook for employment and income.

clip_image006

The assessment of the present situation also improved with the index rising more than 3-1/2 points but to a still severely depressed level of 28.6, reports Econoday. Pessimism is easing with fewer describing current business conditions as bad and fewer describing jobs as hard to get (45.0 percent vs. March’s 46.3 percent). Other details show a jump in buying plans for cars and major appliances though buying plans for homes are still under water. Inflation expectations, despite the month’s rise in gasoline prices, eased slightly.

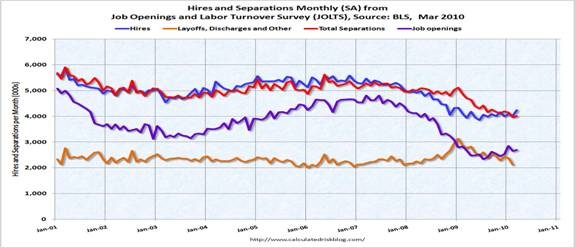
So the recovery is finally beginning for Main Street. I like Calculated Risk’s chart on this. According to the Labor Department’s JOLT report (Job Openings and Labor Turnover Summary), there were 4.242 million hires in March (Seasonally Adjusted), and 4.016 million total separations, or 226 thousand net jobs gained. Notice that total job separations have been dropping since January ‘09, while the number of both job openings and hires has been rising since mid-2009, the probable end of this recession.

clip_image008

So even though the unemployment rate is declining slowly, it is already a long term trend, folks. And though the median duration of unemployment rose to 21.6 weeks from 20.0 weeks in March and the percentage of unemployed, marginally attached and part time is still above 16 percent of the workforce, it is mainly because more people are optimistic about finding a job (805,000 actually rejoined the workforce in April).

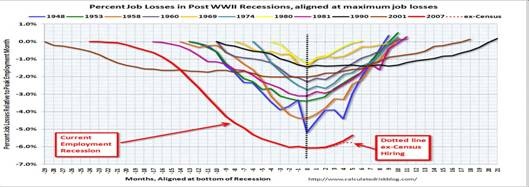
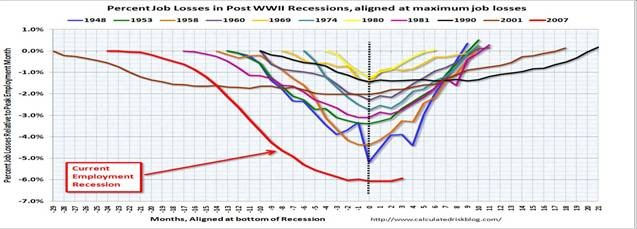
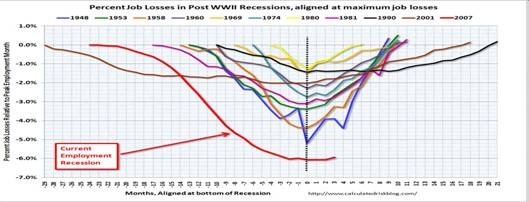
It’s true that short-term attitudes can change on a dime, as the DOW’s 900 point drop proves. But the longer term trend of “public thinking”, as Shiller calls it, seems to be greater optimism rather than pessimism. Just look at comparisons to other post-WWII recessions done by Calculated risk. It shows that the two longest jobless recoveries were during Republican administrations—Bush I &II—which were ruled by an ideology that opposed government stimulus spending. The Obama Administration has taken the opposite attack—pump as much government stimulus as possible into the economy to speed up the recovery. And it seems to be working.

Harlan Green © 2010

Posted in Macro Economics, Weekly Financial News | Tagged , , | Leave a comment

Why the Housing Bubble?

The Mortgage Corner

Historical hindsight is always 20-20, but why didn’t economists and the Fed act sooner to deflate the housing bubble? By waiting until 2006 to tighten credit, the Federal Reserve allowed overbuilding of the housing sector that resulted in the current oversupply of some 1 million homes.

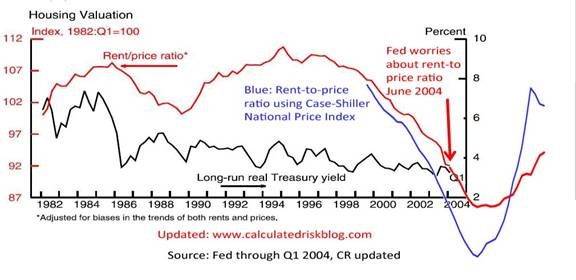
Housing bubbles can be detected and treated if Fed officials and others had heeded their own research. One measure they looked at was the housing rent-to-price ratio, or ratio of housing rents to prices. When prices rise much higher in relation to rents, then we know those rises are not sustainable, but speculative.

The Federal Reserve was worried about a housing bubble as far back as 2004, according to Calculated Risk. But nothing was done about it under Alan Greenspan’s chairmanship. We now know why. Greenspan didn’t believe housing prices could rise to bubble heights. He maintained housing wasn’t as ‘liquid’ as other investments, and so subject to the same speculation as stock and bond values that created the dot-com bubble. But that proved not to be true when the Fed changed its monetary policy that brought in the low interest rates and easy credit lasting from 2002 to 2006.

clip_image002

The Fed was looking at a ratio calculated by one of its researchers that saw rents had plunged to less than 2 percent of housing prices in 2004, due to soaring home prices. “I don’t want to leave the impression that we think there’s a huge housing bubble,” said the Fed’s associate director of research. “We believe a lot of the rise in house prices is rooted in fundamentals. But even after you account for the fundamentals, there’s a part of the increase that is hard to explain”.

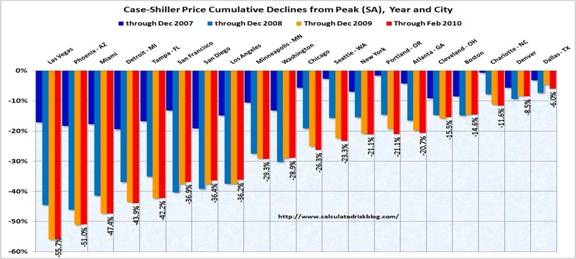
But economists such as Robert Shiller saw the housing bubble, as we reported last week. He told the Fed in 2005 that housing prices could plunge as much as 50 percent in some regions. And that has happened in cities like Las Vegas and Phoenix, with Detroit, Miami and Tampa, Florida not far behind.

clip_image004

Homeownership rates have also plunged from 69 to 67 percent of households, according to the U.S. Census Bureau, as more households return to renting. Could the exodus of homeowners that become renters turn into a flood? The homeownership rate was as low as 64 percent in 2004, and the historical average seems to hover around 65 percent. Is that the actual percentage of households who can truly afford to own? Time will tell.

clip_image006

First quarter GDP growth was 3.2 percent, the third consecutive quarter of economic growth. Both residential and non-residential investment are still a drag on growth, so that equipment and software investment are pulling us out of the recession. But it looks like housing construction (i.e., residential investment) is poised to become a positive factor. Note that the recession probably ended in mid-2009, according to Calculated Risk.

clip_image008

The consumer sector is helping the recovery gain traction. Not only did income improve but spending accelerated. Personal income strengthened in March, gaining 0.3 percent, following a 0.1 percent rise the prior month. The heavily-weighted wages & salaries component increased 0.2 percent in March after edging up 0.1 percent in February.

clip_image010

Consumer spending rose at a faster pace due to a jump in motor vehicle sales. Overall, personal consumption posted a 0.6 percent boost in March, following a 0.5 percent jump the month before. The March figure equaled expectations but February spending was revised up from a 0.3 percent initial estimate. By components, durables spiked 3.6 percent in March, nondurables advanced 0.3 percent, and services rose 0.2 percent.

Subdued is still the word on inflation-keeping the Fed happy and loose for now. The headline PCE price firmed to up 0.1 percent after no change in February. The core rate also edged up 0.1 percent in March after no change the month before. The market forecast was for no change in the core.

clip_image012

Personal income growth for March rose to 3.0 percent over last year, rising from 2.2 percent in February. Year-ago headline PCE inflation firmed to 2.0 percent from 1.8 percent in February. The so-called core PCE inflation without energy and food prices was steady at 1.3 percent.

The Fed was caught up in the ‘group think’ of that time, which said that freeing markets to run their own course was the path to greater prosperity. Greenspan, et. al., wanted to foster faster economic growth without heeding the warning signs, in other words.

Surprise, surprise, it turns out that asset bubbles can be detected. Ideology cannot trump reality, as much as Greenspan’s Federal Reserve attempted to overturn it. We also see that the rent-to-price ratio has returned to historical levels, more evidence that housing prices have finally stabilized.

Harlan Green © 2010
Posted in Weekly Financial News | Tagged , , , , , , | Leave a comment